
Figures & data
Table 1 Chemotherapy Regimens
Table 2 Patient Characteristics Before and After Propensity Score Matching
Table 3 Adverse Events Before and After Propensity Score Matching
Figure 1 Kaplan-Meier survival curves in patients treated with ≤4 cycles and ≥5 cycles of chemotherapy before and after matching. (A) Before matching, the 3-year OS rates between the ≤4 cycles and ≥5 cycles groups were 82.5% and 87.2% (p = 0.500). (B) Before matching, the 3-year PFS rates between the ≤4 cycles and ≥5 cycles groups were 77.1% and 79.1% (p = 0.567). (C) After matching, the 3-year OS rates between the ≤4 cycles and ≥5 cycles groups were 81.9% and 88.9% (p = 0.309). (D) After matching, the 3-year PFS rates between the ≤4 cycles and ≥5 cycles groups were 76.4% and 80.6% (p = 0.449).
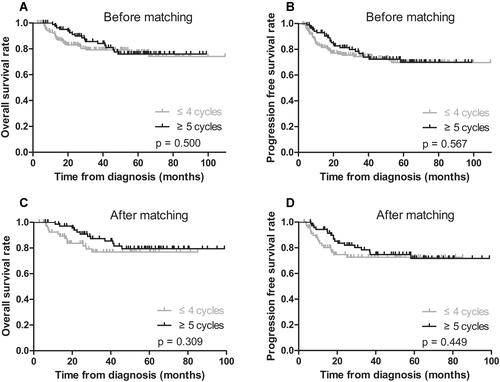
Table 4 Univariate and Multivariate Analyses for Factors Affecting Survival Outcomes Before and After Propensity Score Matching
Figure 2 Subgroup analyses of low-risk stage IE and IIE patients about chemotherapy courses with OS and PFS after matching. (A) The 3-year OS rates between the ≤4 cycles and ≥5 cycles groups were 93.0% and 91.1% (p = 0.336) in stage IE. (B) The 3-year PFS rates between the ≤4 cycles and ≥5 cycles groups were 88.4% and 80.0% (p = 0.220) in stage IE. (C) The 3-year OS rates between the ≤4 cycles and ≥5 cycles groups were 65.5% and 85.2% (p = 0.024) in stage IIE. (D) The 3-year PFS rates between the ≤4 cycles and ≥5 cycles groups were 58.6% and 81.5% (p = 0.027) in stage IIE.
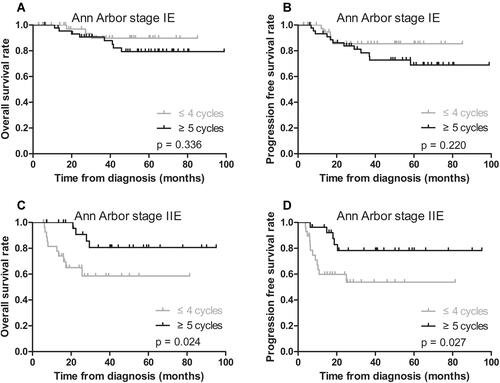
Table 5 Chemoradiotherapy for Stage IE-IIE Extranodal NK/T Cell Lymphoma, Nasal Type