
Figures & data
Figure 1 Decision tree model.
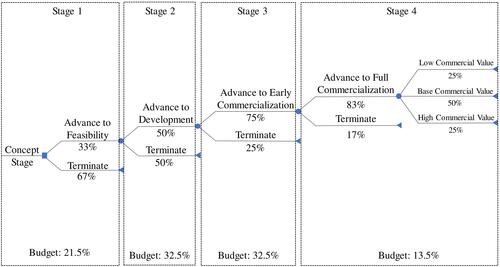
Table 1 Parameters Used in the Model
Table 2 R&D Performance of All Included CountriesCitation2
Figure 2 Linear regression analysis on countries’ GERD for medical and health sciences with the percentage of innovative products.
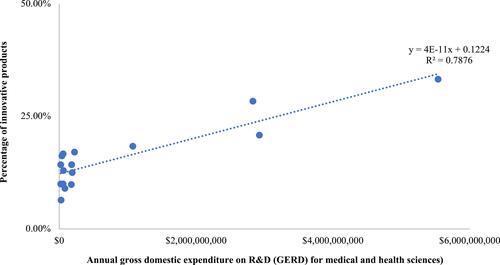
Table 3 Incremental Cost-Effectiveness Ratio (ICER) in a 3-Year Time Horizon Analysis
Table 4 Cost per Innovative Product on the Sensitivity Analysis