
Figures & data
Figure 1 Schematic diagram of the position of anteroposterior approach mesh.
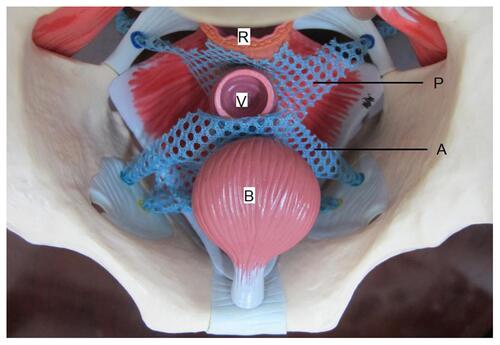
Figure 2 (A) The puncture points of the posterior arm of the mesh in sacrospinous ligament. (B) The puncture points of the anterior and middle arm of the mesh in the obturator.
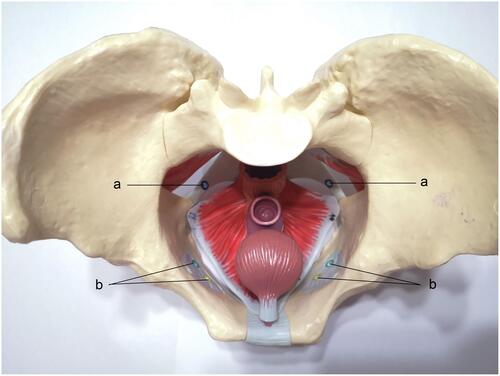
Figure 3 Schematic diagram of the position of six-arm mesh.
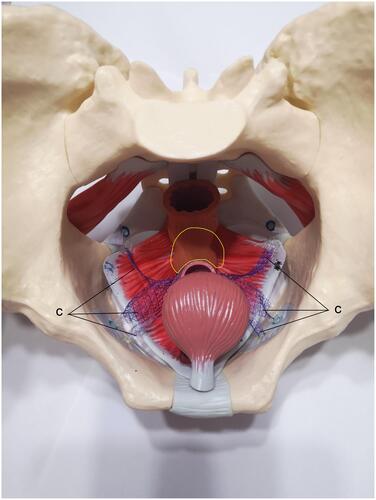
Table 1 Comparison of Patient Clinical Characteristics Between the Two Groups
Table 2 Comparison of Intraoperative Conditions and Postoperative Recovery Between the Two Groups
Table 3 Comparison of POP-Q Score in Both Groups Before and at 3, 6, and 12 Months After Surgery
Table 4 Pre- and Postoperative Comparison of PFDI-20 and FSFI Scores Between the Two Groups
Table 5 Comparison of Postoperative Complications Between the Two Groups