
Figures & data
Table 1 Clinicodemographic Characteristics of Patients with Severe HFMD
Figure 1 ROC curve and interactive dot diagram for calculating optimal cutoff value of NLR in in predicting mortality generated for 664 patients with critical HFMD.
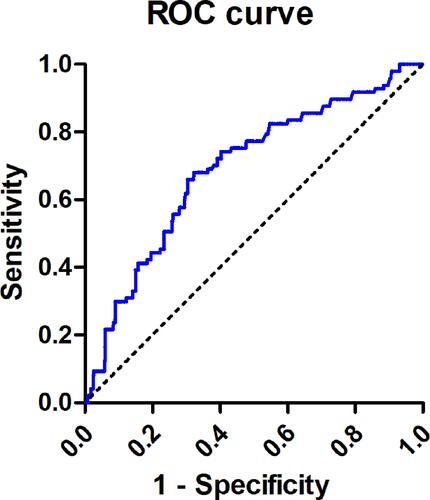
Table 2 Analysis of Potential Risk Factors for Severe HFMD
Table 3 Clinicodemographic Characteristics of Patients with Critical HFMD Who Died or Survived During the Study Period
Figure 2 ROC curve and interactive dot diagram for calculating optimal cutoff value of NLR in predicting mortality generated for 137 patients with critical HFMD.
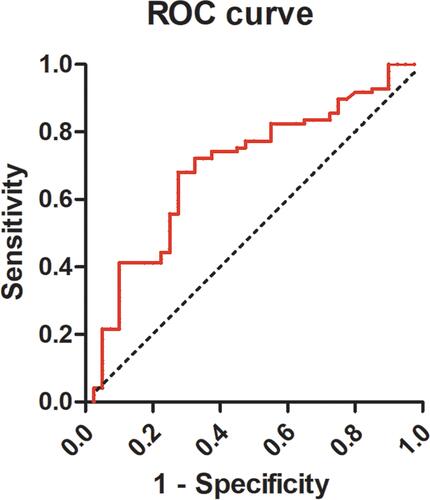
Table 4 Analysis of Risk Factors for Mortality Associated with Severe HFMD