Figures & data
Table 1 Characteristics of the Patients with Sepsis
Table 2 Association of RPR with Clinical Outcomes
Table 3 Threshold Effect Analysis of RPR on 28-Day Mortality with Piecewise Linear Regression
Figure 1 Smooth curve fitting for the association between RPR and 28-day mortality. A non-linear relationship was detected after adjusting for Model II in .
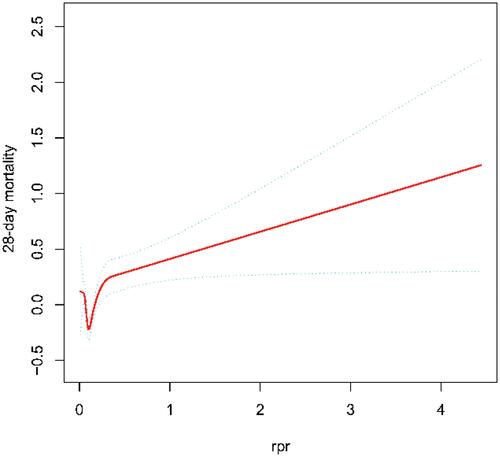
Table 4 Stratified Analyses of the Association Between RPR and 28-Day Mortality
Figure 2 Kaplan–Meier curve of 28-day survival in sepsis patients. Patients were divided into two groups according to RPR (RPR<0.134 and RPR ≥0.134).
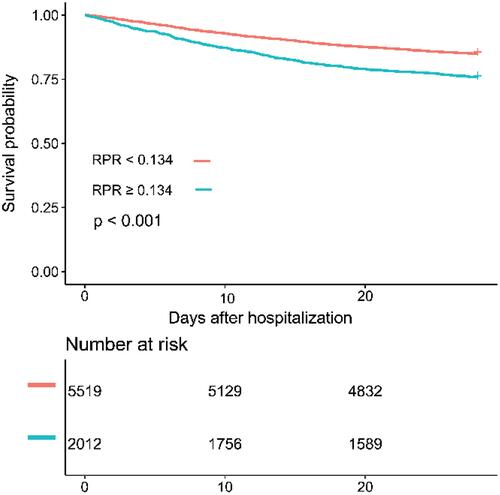
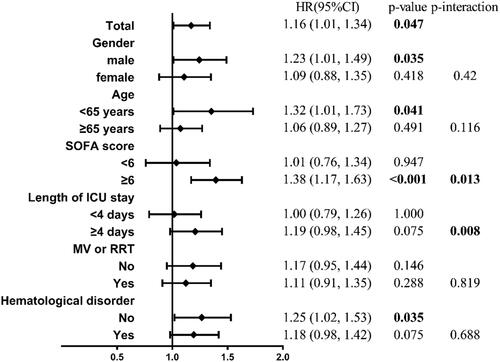
Figure 3 Forest plot for stratified analyses.
Notes: Cox proportional hazards model was adjusted for Model II in Table 2. Variable was excluded from the adjusted model when considered as a stratification variable. Statistically significant p-value (p< 0.05) was shown in bold.Abbreviations: MV, mechanical ventilation on the first day; RRT, renal replacement therapy on the first day; SOFA, Sequential Organ Failure Assessment.