Figures & data
Table 1 Visual Acuity and Central Macular Thickness Prior to Nepafenac Administration and in the Last Follow-Up in Patients with Acute and Chronic Macular Edema
Table 2 Mean±Standard Deviations (SD) of Best Corrected Visual Acuity (BCVA) and Central Macular Thickness (CRT) Prior to Nepafenac Administration and in the Last Follow-Up in Patients with Acute and Chronic Macular Edema. Statistical Significance: P<0.05.
Figure 1 Changes in best corrected visual acuity (BCVA) in acute and chronic cystoid macular edema (CME) prior to and after treatment of patients. Statistical significance, P<0.05.
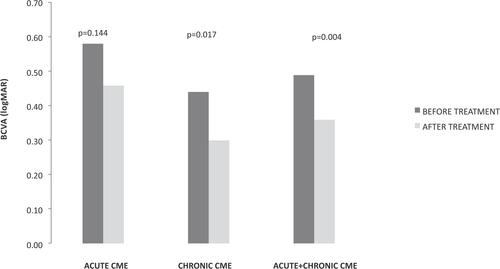
Figure 2 Changes in central retinal thickness (CRT) in acute and chronic cystoid macular edema (CME) prior to and after treatment of patients. Statistical significance, P<0.05.
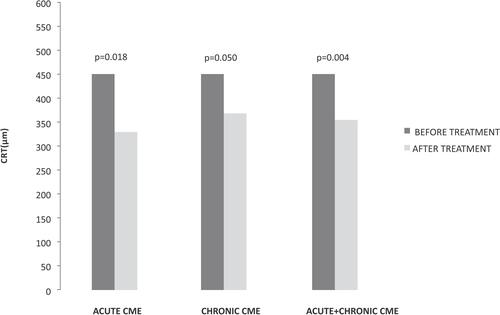
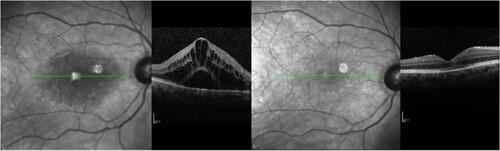
Figure 3 Patient with acute pseudophakic ME before nepafenac administration and after 4 months therapy. Visual acuity elevated from 0.44 logMAR to 0.30 logMAR, and central macular thickness decreased from 601 μm to 379 μm. Green line represents the same area of the fovea prior to and after therapy in infrared picture, which corresponds to CME improvement.
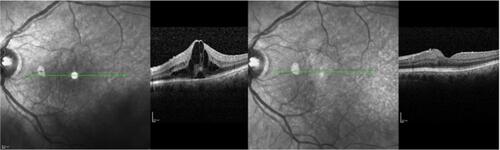
Figure 4 Patient with chronic CME. CME before nepafenac administration and after 4 months therapy. Visual acuity changed from 0.50 logMAR to 0.30 logMAR, and central macular thickness decreased from 499 μm to 255 μm. Green line represents the same area of the fovea prior to and after therapy in infrared picture, which corresponds to CME improvement.