Figures & data
Figure 1 Flow chart of the research.
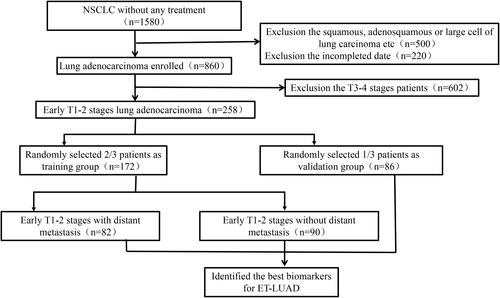
Table 1 Demographic and Clinical-Pathological Characteristics of the Training Cohort and Validation Cohort
Table 2 Univariate Logistic Proportional Hazards Regression Analysis in the Training Cohort
Table 3 Multivariate Logistic Proportional Hazards Regression Analysis in the Training Cohort
Table 4 Spearman Correlation Analysis ET-LUAD and Clinicopathological Characteristics
Figure 2 Correlation analysis between ET-LUAD with distant metastases and clinicopathological characteristics in the training cohort. The early M1 stages in (A–E) expression is higher than early M0 stages, but lower than the lymphocyte count (F). The serum LDH, CEA, NSE and Cyfra211 expression were calculated by log2.
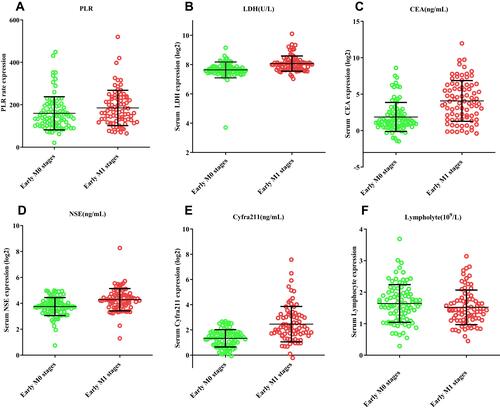
Figure 3 The nomogram predicting metastasis possibility for patients with non-metastatic ET-LUAD in the training cohort. The univariate and multivariate logistic hazards regression analysis identified independent risk factors and incorporated those variables to established nomogram model, including PLR, serum CEA, LDH, NSE, and Cyfra211. Then mark the data of those five variables on the interactive nomogram. Each variable is represented by a horizontal line, and the patient’s information is marked on the coordinates. The regression coefficient of each predictive variable corresponds to the score value in the range of 0–100. The total score of the five variables was obtained by adding the corresponding scores, and the metastasis possibility obtained for ET- LUAD. The red dot on the scale represents the corresponding score of the variable. Pr (Metastasis), ET-LUAD with metastasis. (*P<0.05, **P<0.01).
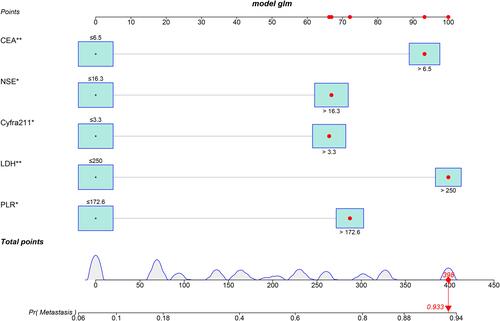
Figure 4 The discrimination and calibration curves of prediction model.
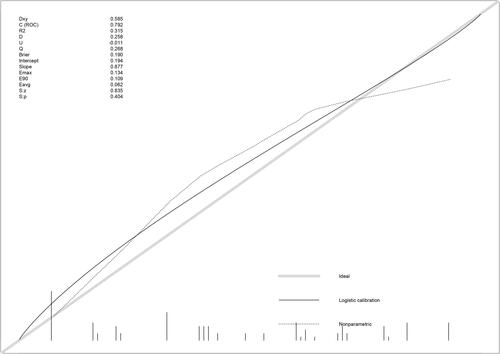
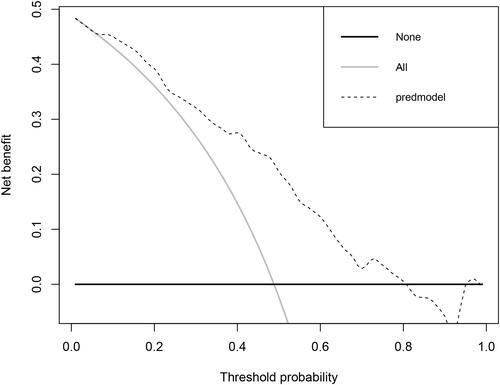
Figure 5 The decision curve analyses (DCA) for the clinical values of this model. The Y-axis represents the net benefit. The dotted line represents the clinicopathologic nomogram. The gray line represents the hypothesis that all patients are involved in distant metastases. The black solid line represents the hypothesis that no patients are involved in distant metastases. The X-axis represents the metastasis possibility. The metastasis possibility is where the expected benefit of treatment is equal to the expected benefit of avoiding treatment.