Figures & data
Table 1 Clinical Information of 5 Patients with BKPyVAN
Table 2 Comparison of Decoy Cells in Urine, Plasma BK Viral Load and Pathological Findings at the Time of Pre-Treatment and Post-Treatment with IVIG
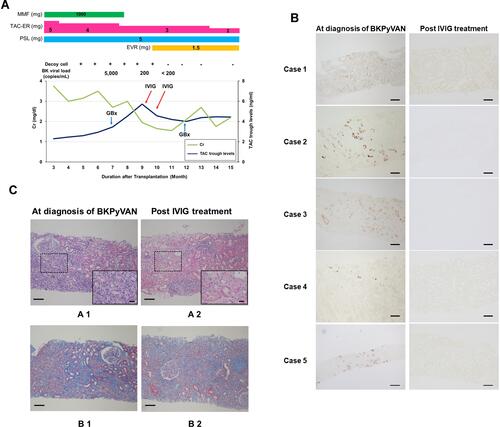
Figure 1 Comparison of representative renal histopathological findings at the time of initial biopsy and repeated biopsy after IVIG therapy. (A) Clinical course of typical case (case 3). (B) SV40 positive cells diminished after IVIG therapy in all cases. (C) Many intranuclear inclusions were observed and lymphocytes infiltrated into the interstitium (A1). After IVIG therapy, the inclusion bodies in the nucleus disappeared. The number of lymphocytes was decreased (A2). A wide range of interstitial fibrosis was observed in the sample of initial diagnosis (B1). The area of interstitial fibrosis improved after IVIG therapy (B2). HE staining for A1 and A2 and Elastica-Masson staining for B1 and B2. Magnification: 100 × for all pictures, 400 × for inset pictures of A1 and A2. Scale bars = 100um.