Figures & data
Figure 1 Unet architecture, the boxes represent feature map consist of multi-channels, the number of channels in each layer is on the top of each box. The arrows colored by five colors corresponds to five kinds of convolutional operation which can be found on the right bottom of the figure.
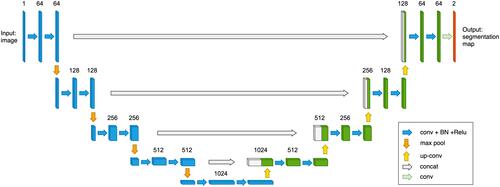
Table 1 Initial CT Findings of 270 Patients with Coronavirus Disease 2019 (COVID-19)
Figure 2 IOU distribution for all lesions. As shown in this figure, there are two peaks in the distribution, which means most predictions may have high IOU value or very low IOU value, and the average IOU is 0.7894.
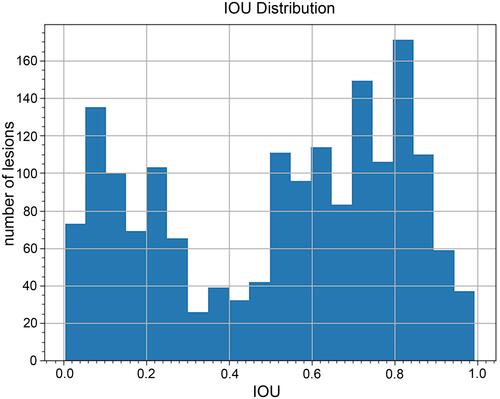
Figure 3 Predict results of the AI system. (A, C): predicted by AI system, (B, D): labeled by radiologist.
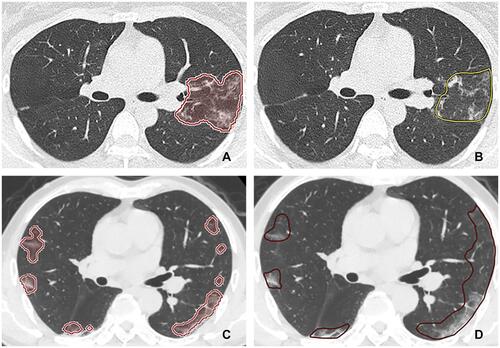
Figure 4 Volume distribution for all lesions.
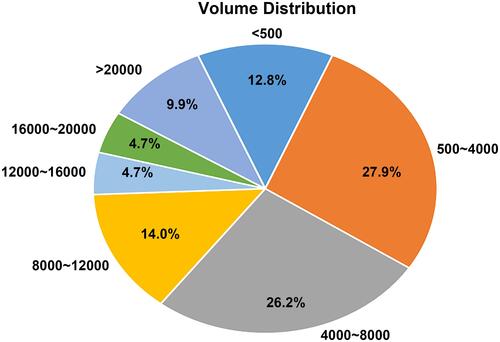
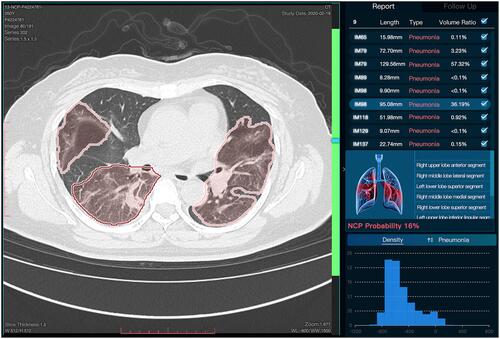
Figure 5 The working model of DL on chest CT for a forty-nine years old woman. The upper right panel shows the ratio of the total volume of lesions to lung volume, which was more than 95%. The three-dimensional display and the density of lesions were shown in the middle and the inferior of right panel. This COVID-19 patient was hospitalized again and presented with a positive nucleic acid test again.