Figures & data
Table 1 Participant Characteristics (n = 200)
Table 2 Cronbach’s α of the QoR‑40 at Different Assessment Time Points
Table 3 The Spearman Correlation Between QoR-40C and Subscales
Table 4 QoR-40C Factor Analysis
Table 5 Spearman Correlation Between QoR-40C and SF-36 Scores
Table 6 Change in the QoR-40C of Patients’ Baseline and POD3
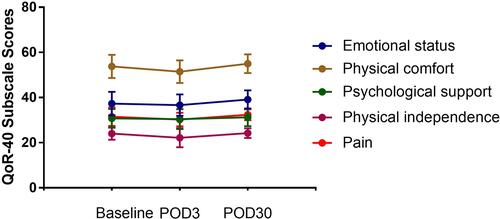
Figure 1 Changes (Mean ±SD) in QoR‑40 subscale scores at different assessment time points.