Figures & data
Table 1 Characteristics of the Patients in the Sample
Figure 1 Description of the AE screening process.
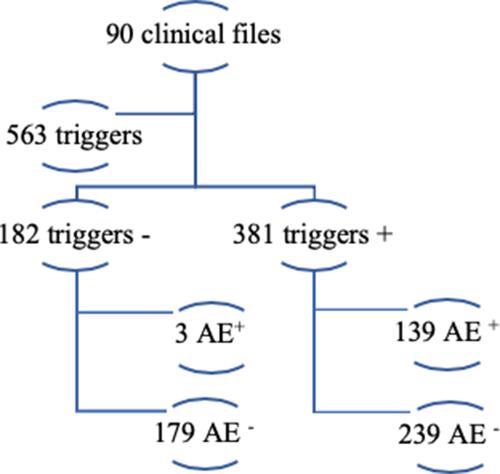
Table 2 The GTT-PT Global Predictive Properties
Figure 2 Standardized residual regression graph (A) and dependent and independent variable dispersion graph (B).
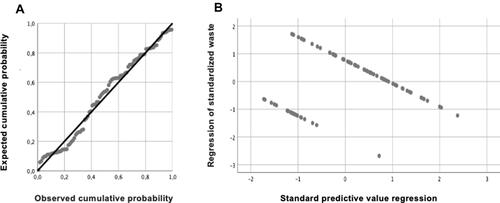
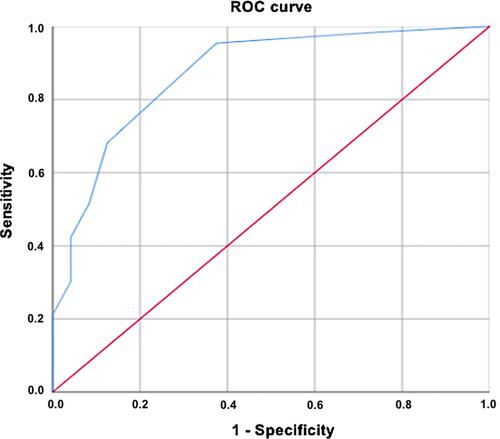
Figure 3 ROC curve graph with the respective area under the curve (AUC).