
Figures & data
Table 1 Comparison of General Clinical Data Between Two Groups
Figure 1 Flow diagram of the study design.
Abbreviation: SAPB, serratus anterior plane block
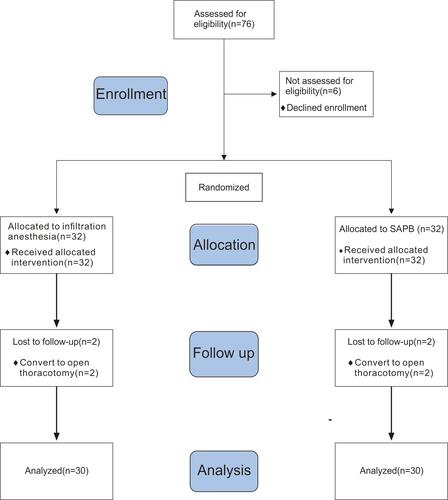
Figure 2 Kaplan–Meier curves comparing time to VAS =4 within 48 hrs after operation in two groups (patients were censored if VAS did not reach 4 or above within 48 hrs after surgery); survival curve analysis (log-rank test): P=0.008.
Abbreviations: SAPB, serratus anterior plane block; VAS, visual analogue scale.
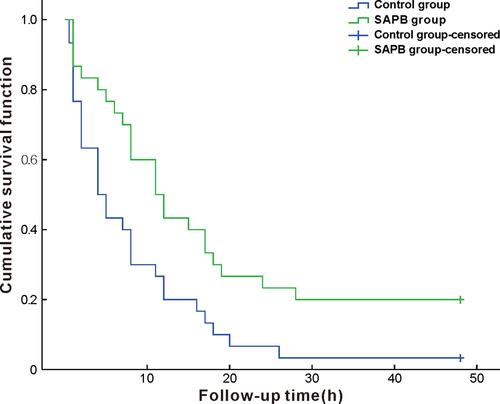
Table 2 The Number of Patients Requiring Additional Analgesics at Different Time Points After Surgery (N)
Table 3 Intraoperative Remifentanil and Propofol Dose (mean±SD)
Table 4 Adverse Reactions