Figures & data
Figure 1 The schematic diagram of recruitment and excluding procedure.
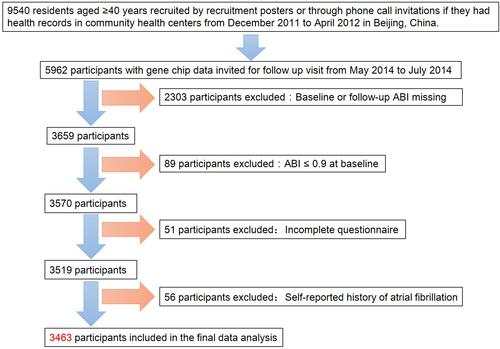
Table 1 Baseline Characteristics of All Eligible Participants
Table 2 Baseline Prevalence of Disease of All Eligible Participants
Table 3 Baseline Laboratory Variable of All Eligible Participants
Figure 2 Smoothing curve of the risk of new-onset PAD by heart rate. Line B represents the smoothing curve for the association of heart rate and new-onset PAD. Lines A and C represent the 95% confidence interval for the risk of new-onset PAD. This relationship was adjusted for sex, age, body mass index, baseline ankle–brachial index, current smoking and drinking status, hypertension, diabetes mellitus, dyslipidemia, cardiovascular disease, and use of antihypertensive agents, lipid-lowering agents, and hypoglycemic agents.
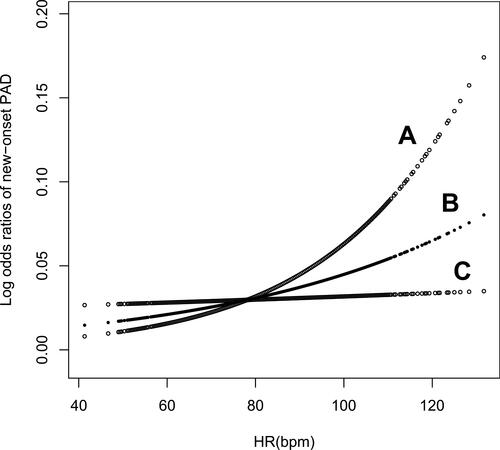
Table 4 Logistic Regression Analysis of the Association of Heart Rate with New-Onset PAD
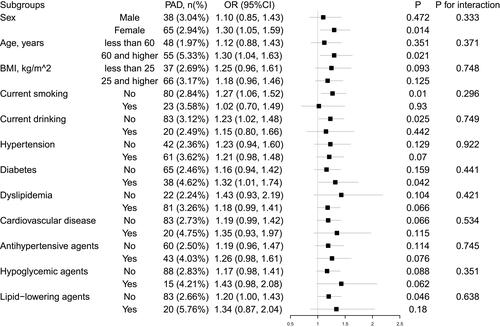
Figure 3 Subgroup analyses and interaction tests in different populations. The subgroup analyses were adjusted for sex, age, body mass index, baseline ankle–brachial index, current smoking and drinking status, hypertension, diabetes mellitus, dyslipidemia, cardiovascular disease, and use of antihypertensive agents, lipid-lowering agents, and hypoglycemic agents.