
Figures & data
Table 1 Comparisons of Demographic Data and Vascular Risk Factors Between Controls and Patients with Acute Intracerebral Hemorrhage
Figure 1 Difference of serum hypoxia-inducible factor 1alpha levels between healthy controls and patients with intracerebral hemorrhage. Using Mann–Whitney U-test, serum hypoxia-inducible factor 1alpha levels were significantly higher in intracerebral hemorrhage patients than in healthy controls (P<0.001).
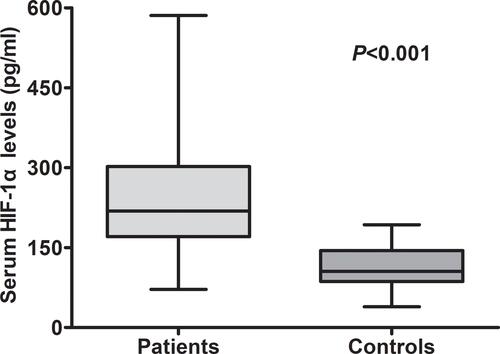
Table 2 Correlative Analysis Between Serum Hypoxia Inducible Factor-1alpha Levels and Other Variables Using Multivariate Linear Regression Analysis in Acute Intracerebral Hemorrhage
Figure 2 Relationship between serum hypoxia-inducible factor 1alpha levels and Glasgow Coma Scale score among intracerebral hemorrhage patients. When Glasgow Coma Scale score was a continuous variable, serum hypoxia-inducible factor 1alpha levels were significantly raised with decreased Glasgow Coma Scale score using Spearman correlation coefficients (P<0.001). And, Glasgow Coma Scale score was identified as a categorical variable and subsequently, patients were divided into three groups in accordance with Glasgow Coma Scale score, namely, 3–8, 9–12 and 13–15, and therefore patients with Glasgow Coma Scale score 3–8 had substantially highest serum hypoxia-inducible factor 1alpha levels, followed by Glasgow Coma Scale score 9–12 and then 13–15 using Kruskal–Wallis H-test (P<0.001). In boxplot, **P<0.01 compared with Glasgow Coma Scale score 3–8, and #P<0.05 compared with Glasgow Coma Scale score 9–12. In correlation graph, the solid line means line of best fit and dashed line represents 95% confidence interval of a population mean.
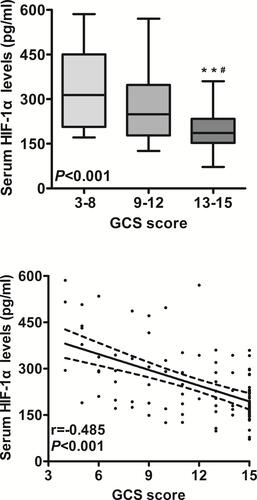
Figure 3 Relationship between serum hypoxia-inducible factor 1alpha levels and hematoma volume after intracerebral hemorrhage. When hematoma volume was a continuous variable, serum hypoxia-inducible factor 1alpha levels were significantly raised with rising hematoma volume using Spearman correlation coefficients (P<0.001). When hematoma volume was identified as a categorical variable and subsequently, patients were divided into two groups in accordance with hematoma volume, namely, above 30 mL and below 30 mL, patients with hematoma volume above 30 mL had substantially higher serum hypoxia-inducible factor 1alpha levels than those with hematoma volume below 30 mL using Mann–Whitney U-test (P<0.001). In correlation graph, the solid line means line of best fit and dashed line represents 95% confidence interval of a population mean.
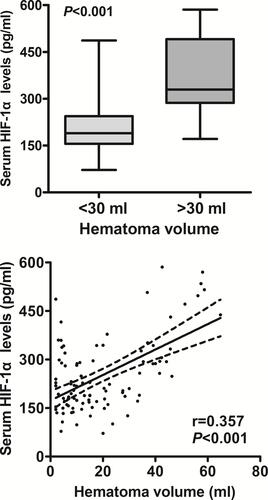
Figure 4 Relationship between serum hypoxia-inducible factor 1alpha levels and Glasgow Outcome Scale score at 90 days after intracerebral hemorrhage. Whether Glasgow Outcome Scale score was a continuous or categorical variable, serum hypoxia-inducible factor 1alpha levels were significantly declined with raised Glasgow Outcome Scale score using Spearman correlation coefficients (P<0.001) or Kruskal–Wallis H-test (P<0.001). In boxplot, **P<0.01 compared with Glasgow Outcome Scale score 1, as well as #P<0.05 and ##P<0.01 compared with Glasgow Outcome Scale score 2. In correlation graph, the solid line means line of best fit and dashed line represents 95% confidence interval of a population mean.
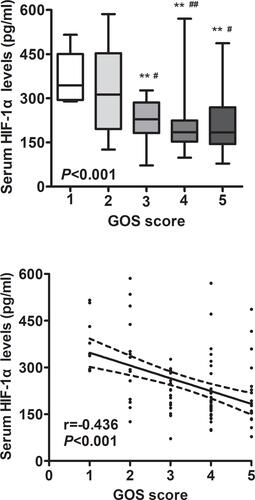
Figure 5 Relationship between serum hypoxia-inducible factor 1alpha levels and poor outcome at 90 days after intracerebral hemorrhage. A poor outcome was defined as Glasgow Outcome Scale of 1–3 at 90 days after hemorrhagic stroke. Serum hypoxia-inducible factor 1alpha levels were significantly elevated in patients with a poor outcome, as compared to those with a good outcome using Mann–Whitney U-test (P<0.001). Under receiver-operating characteristic curve, serum hypoxia-inducible factor 1alpha levels remarkably predicted post-stroke 90-day poor outcome (area under curve, 0.725; 95% confidence interval, 0.625–0.811); and serum hypoxia-inducible factor 1alpha levels more than 239.4 pg/mL distinguished patients with development of poor 90-day outcome with specificity and sensitivity values of 79.3% and 65.9% (Youden index J, 0.452) respectively.
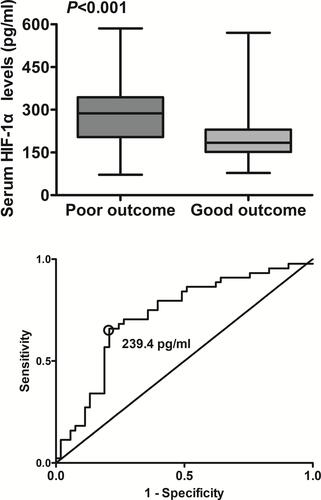
Figure 6 Comparison of discriminatory capability with respect to serum hypoxia-inducible factor 1alpha level, Glasgow Coma Scale score and hematoma volume for 90-day poor outcome following acute intracerebral hemorrhage under receiver operating characteristic curve. A poor outcome was referred to as Glasgow Outcome Scale of 1–3 at 90 days after hemorrhagic stroke. Prognostic predictive ability of serum hypoxia-inducible factor 1alpha level (area under curve, 0.725; 95% confidence interval, 0.625–0.811) was similar to those of Glasgow Coma Scale score (area under curve, 0.792; 95% confidence interval, 0.697–0.868; P=0.248) and hematoma volume (area under curve, 0.817; 95% confidence interval, 0.725–0.888; P=0.124).
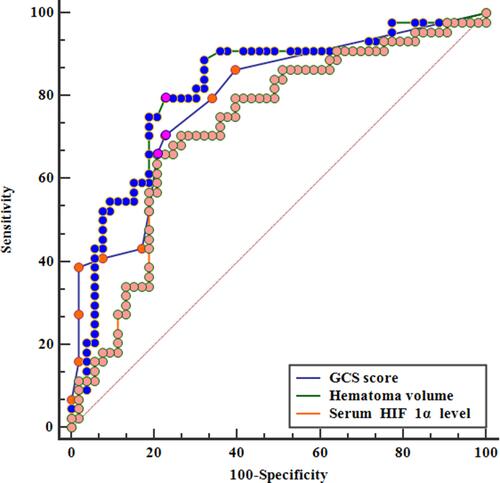
Table 3 Demographic, Clinical, Radiological and Biochemical Factors for 90-Day Poor Outcome in Acute Intracerebral Hemorrhage
Table 4 Predictive Factors of 90-Day Poor Outcome Among Patients with Acute Intracerebral Hemorrhage Using Univariable Logistic Regression Analysis
Table 5 Multivariate Logistic Regression Analysis for Risk Factors of Poor Outcome in Acute Intracerebral Hemorrhage