
Figures & data
Figure 1 Flowchart of the study.
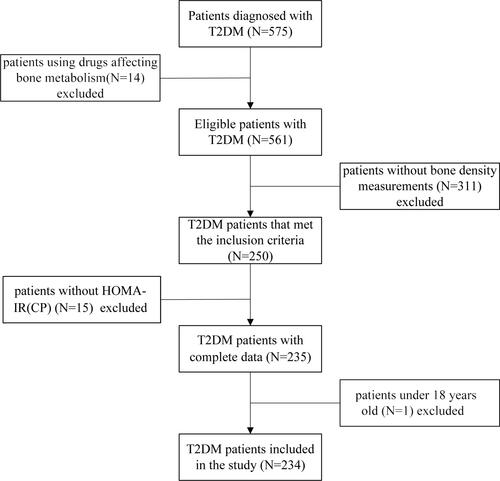
Table 1 Comparison of General Information and Blood Indicators of Different Gender Groups
Table 2 Univariate Analysis of Clinical Data, Blood Indicators, and Osteoporosis of Different Gender Groups
Table 3 Multivariable Logistic Regression Analysis of the Effect of HOMA-IR (CP) on Osteoporosis
Figure 2 The relationship between HOMA-IR (CP) and osteoporosis risk. Adjust for: age, BMI, waist-to-hip ratio, disease course, HOMA-islet (CP-DM), uric acid, triacylglycerol, and high-density lipoprotein.
Abbreviations: HOMA-IR (CP), homeostasis model assessment for insulin resistance based on C-peptide; BMI, body mass index; HOMA-islet (CP-DM), homeostasis model assessment islet beta-cell function based on C-peptide.
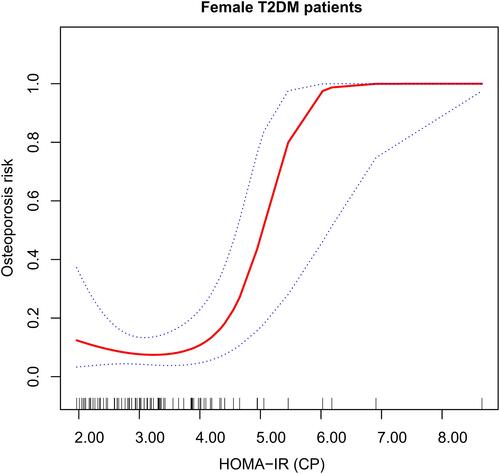
Table 4 Nonlinear Relationship Between HOMA-IR (CP) and Osteoporosis