
Figures & data
Table 1 Baseline Characteristics of Incident Hemodialysis Patients by Hemodialysis Regimen
Table 2 The Changes in Clinical and Laboratory Values Over the First Four Regularly Visits After Initiating Hemodialysis Therapy Among Patients with Incremental Hemodialysis
Table 3 Repeated-Measures Analysis of Changes in Laboratory Values and Blood Pressure Between Groups from Baseline to Post-Baseline Visits
Table 4 Unadjusted and Adjusted Hazard Ratio of RKF Loss by Hemodialysis Regimen
Figure 1 Kaplan–Meier survival curve for (A) RKF loss, (B) the first arteriovenous access complication, (C) death; (D) the composite outcome of mortality and cardiovascular events. Numbers without parentheses in the risk table show the absolute numbers of patients at risk over time and numbers within parentheses show the absolute numbers of patients with events during a period.
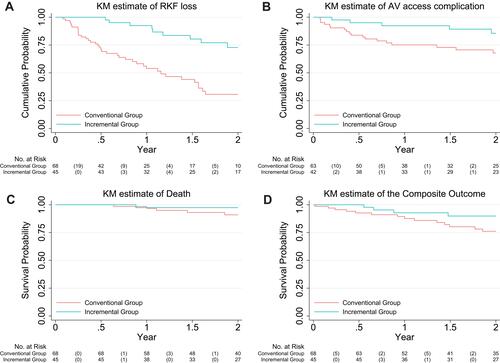
Table 5 Unadjusted and Adjusted Hazard Ratio of Arteriovenous Access Complications by Hemodialysis Regimen
Table 6 Unadjusted and Adjusted Hazard Ratio of the Death and the Composite Outcome of All-Cause Mortality and Cardiovascular Events by Hemodialysis Regimen