
Figures & data
Figure 1 The derivation of the study groups.
Abbreviations: ICAD, intracranial atherosclerosis disease; ICAS, intracranial artery stenosis; TIA, transient ischemic attacks.
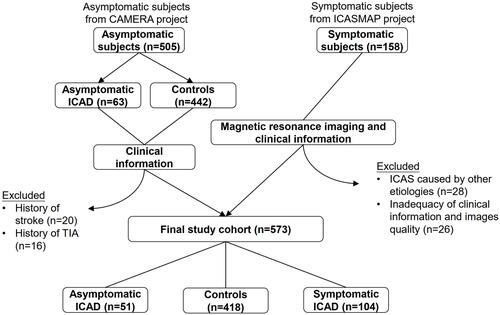
Table 1 The Clinical Characteristics of the Study Subjects
Table 2 Comparison of Vascular Risk Factor Prevalence Between 3 Groups by Univariate Logistic Regression Analysis
Table 3 Comparison of Vascular Risk Factor Prevalence Between 3 Groups by Multivariate Logistic Regression Analysis