Figures & data
Table 1 Trial Characteristics
Figure 1 Flow diagram.
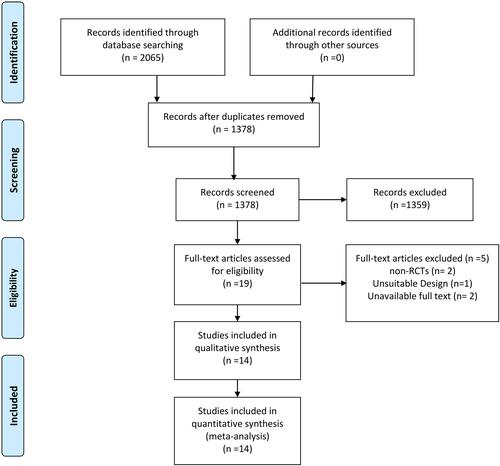
Table 2 The GRADE Level of Certainty for Main Outcome
Figure 2 Risk-of-bias summary.
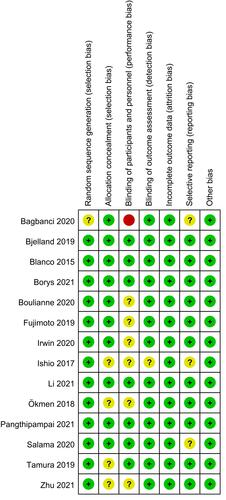
Figure 3 Forest plot of postoperative rest pain score. (A) Rest pain scores at 6 h after surgery. (B) Rest pain scores at 12 h after surgery. (C) Rest pain scores at 24 h after surgery.
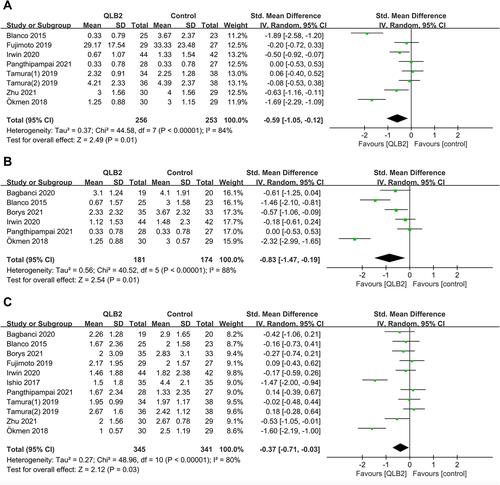
Figure 4 Forest plot of postoperative dynamic pain score. (A) Dynamic pain scores at 6 h after surgery. (B) Dynamic pain scores at 12 h after surgery. (C) Dynamic pain scores at 24 h after surgery.
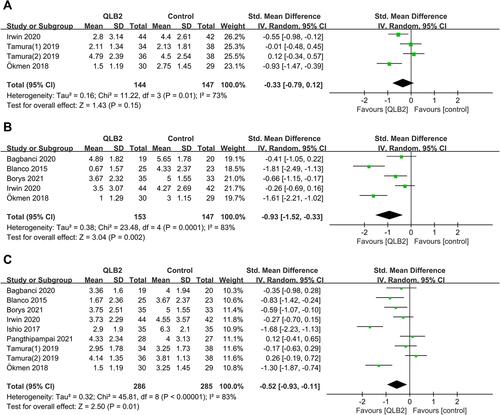
Figure 5 Forest plot of opioid consumption. (A) Opioid consumption at 6 h after surgery. (B) Opioid consumption at 12 h after surgery. (C) Opioid consumption at 24 h after surgery.
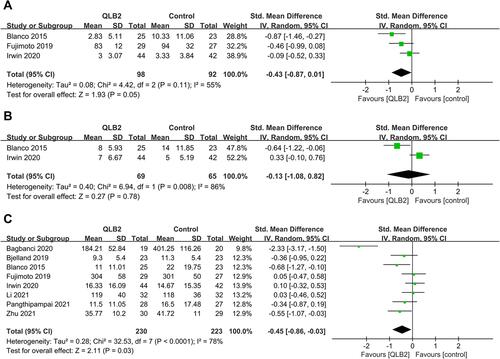
Figure 6 Forest plot of postoperative nausea and vomiting.
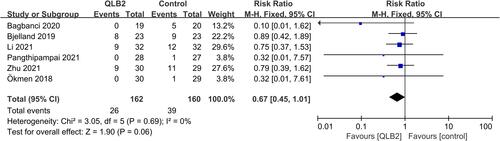
Table 3 The Result of Subgroup Analysis
Figure 7 Forest plot of rest pain scores at 24 h after surgery by subgroup.
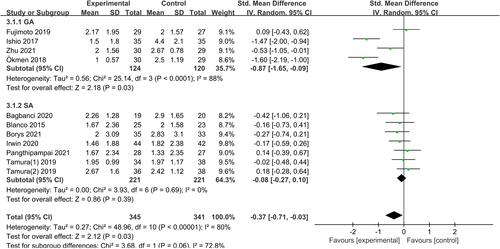
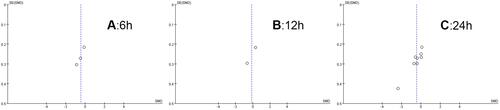
Figure 8 Begg’s funnel plot of rest pain scores.
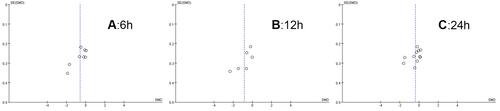
Figure 9 Begg’s funnel plot of dynamic pain scores.
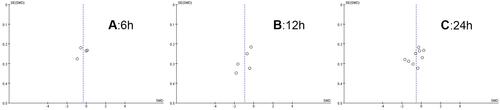
Figure 10 Begg’s funnel plot of opioid consumption.