Figures & data
Figure 1 Vertebral bodies before (A) and after (B) treatment for 14 months for a child with Type I osteogenesis imperfecta.
Note: Copyright © 2011. Karger Publishers, Basel, Switzerland. Semler O, Beccard R, Palmisano D, et al. Reshaping of vertebrae during treatment with neridronate or pamidronate in children with osteogenesis imperfecta. Horm Res Paediatr. 2011;76(5): 321–327.Citation15
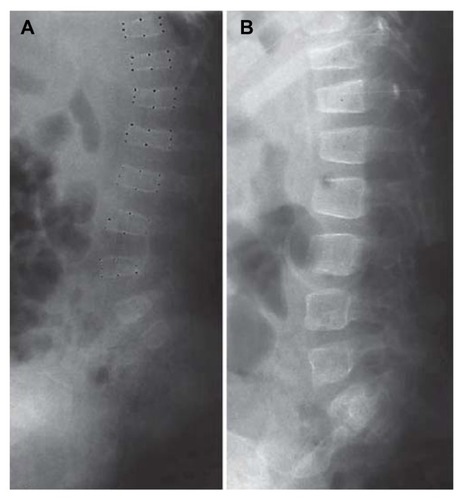
Figure 2 Mean serum alkaline phosphatase levels during the 36-month study for the intramuscular and intravenous neridronate regimens.
Notes: The shaded area represents the normal range of serum alkaline phosphatas. Copyright © 2011 American Society for Bone and Mineral Research. Merlotti D, Rendina D, Gennari L, et al. Comparison of Intravenous and Intramuscular neridronate regimens for the treatment of Paget disease of bone. J Bone Miner Res. 2011;26(3):512–518.Citation28
Abbreviations: NER, neridronate; i.v., intravenous; i.m., intramuscular.
Abbreviations: NER, neridronate; i.v., intravenous; i.m., intramuscular.
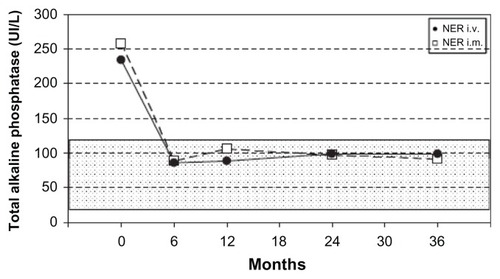
Figure 3 Double-blind phase: VAS trends from baseline to day 40 in patients with complex regional pain syndrome type I treated with neridronate or placebo.
Note: Varenna M, Adami S, Rossini M, et al. Treatment of complex regional pain syndrome type I with neridronate: a randomized, double-blind, placebo-controlled study. Rheumatology. 2013;52(3):534–542, by permission of Oxford University Press.Citation45
Abbreviations: VAS, visual analog scale; SD, standard deviation.
Abbreviations: VAS, visual analog scale; SD, standard deviation.
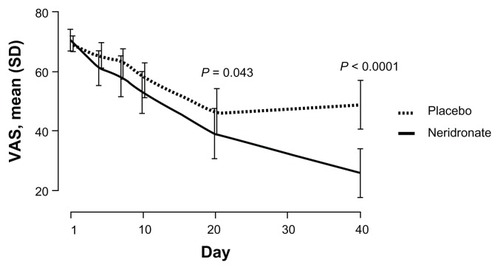
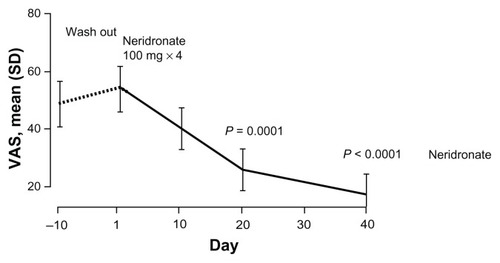
Figure 4 VAS values at the end of the follow-up period of the double-blind phase (day −10) and after the treatment course with intravenous neridronate in patients with complex regional pain syndrome type I.
Note: Varenna M, Adami S, Rossini M, et al. Treatment of complex regional pain syndrome type I with neridronate: a randomized, double-blind, placebo-controlled study. Rheumatology. 2013;52(3):534–542, by permission of Oxford University Press.Citation45
Abbreviations: VAS, visual analog scale; SD, standard deviation.
Abbreviations: VAS, visual analog scale; SD, standard deviation.