Figures & data
Figure 1 Flow diagram of search.
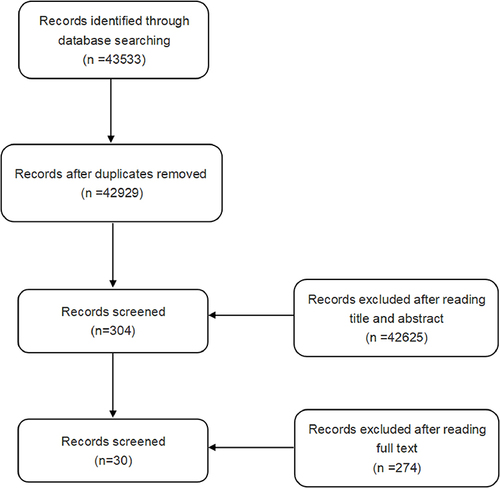
Table 1 Characteristic of Included Studies
Figure 2 Risk of bias.
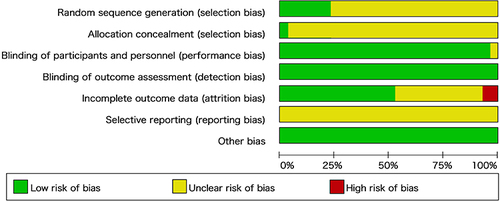
Figure 3 Network of evidence.
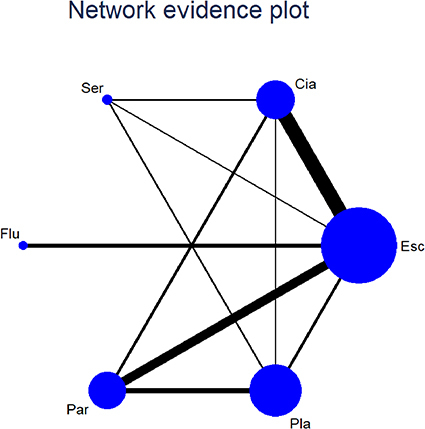
Table 2 Results of SSRIs for the Incidence of Induced-Digestive System Side-Effects from Network Meta-Analysis
Figure 4 Forest plots of network meta-analysis of all trials for acceptability. (A) Forest plots for the outcomes compared with Escitalopram. (B) Forest plots for the outcomes compared with Citalopram. (C) Forest plots for the outcomes compared with Sertraline. (D) Forest plots for the outcomes compared with Fluoxetine. (E) Forest plots for the outcomes compared with Paroxetine. (F) Forest plots for the outcomes compared with Placebo.
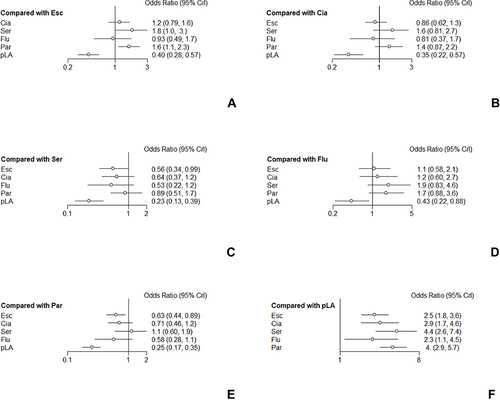
Table 3 Rank Probability of Caused Digestive System Side Effects Among SSRIs
Figure 5 Rank probability of caused digestive system side effects among SSRIs.
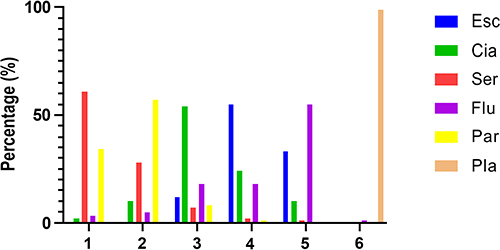
Figure 6 The heterogeneity of the included studies.
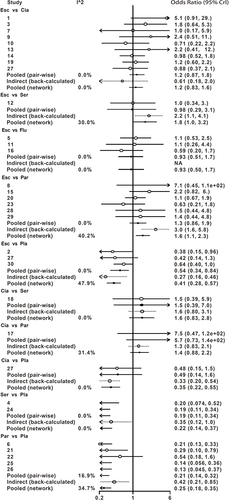
Figure 7 Summarized results of direct and indirect comparisons between different SSRI.
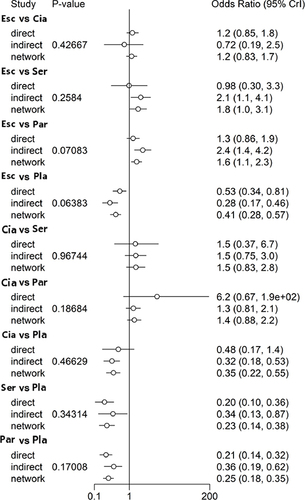
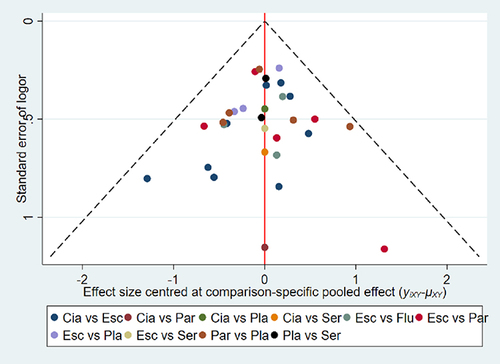
Figure 8 Comparison-adjusted funnel plots.