Figures & data
Table 1 Baseline Characteristics of the Included 354 Patients
Table 2 Univariate and Multivariate Analyses to Identify Factors Predicting Postoperative Major Complications
Table 3 Univariate and Multivariate Analyses to Identify Factors Predicting Severe PHLF
Figure 1 (A) ROC curves and (B) DCA plot analyses of ICG‐R15, Child–Pugh, MELD and ALBI scores for assessing postoperative major complications.
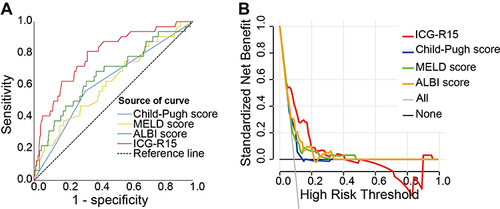
Figure 2 (A) ROC curves and (B) DCA plot analyses of ICG‐R15, Child–Pugh, MELD and ALBI scores for assessing severe PHLF.
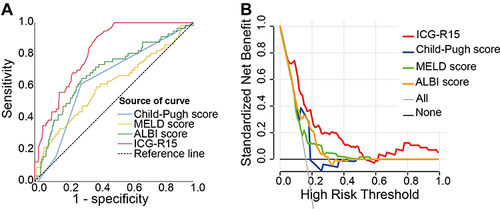
Figure 3 ROC curves of ICG‐R15, Child–Pugh, MELD and ALBI scores for assessing postoperative major complications in the HBV-related HCC patients subgroups. Subgroups include (A) cirrhosis, (B) no cirrhosis, (C) major hepatectomy, (D) minor hepatectomy, (E) blood loss ≥400 mL, (F) blood loss <400 mL, (G) blood transfusion, (H) no blood transfusion, (I) BCLC-0 or -A stage, and (J) BCLC-B or -C stage.
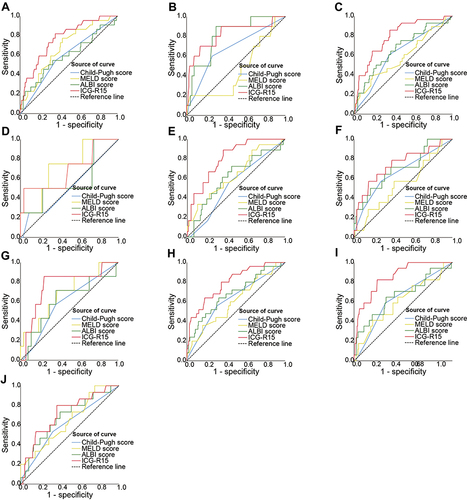
Figure 4 ROC curves of ICG‐R15, Child–Pugh, MELD and ALBI scores for assessing severe PHLF in the HBV-related HCC patients. Subgroups include (A) cirrhosis, (B) no cirrhosis, (C) major hepatectomy, (D) minor hepatectomy, (E) blood loss ≥400 mL, (F) blood loss <400 mL, (G) blood transfusion, (H) no blood transfusion, (I) BCLC-0 or -A stage, and (J) BCLC-B or -C stage.
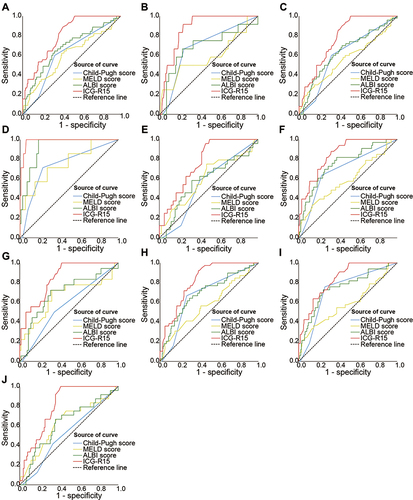
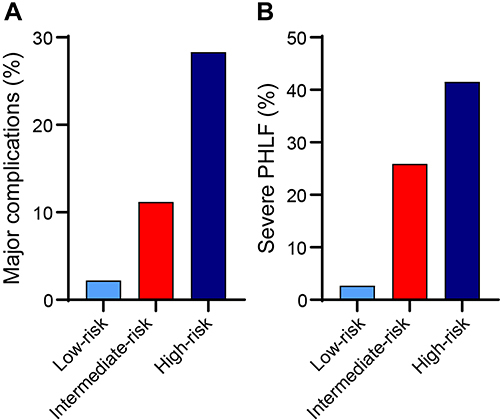
Figure 5 Relationship between the incidence of (A) postoperative major complications and (B) severe PHLF based upon risk group stratification assessed using the ICG-R15 in all included HBV-related HCC patients.