Figures & data
Table 1 Demographic Characteristics of the Study Participants (N = 90)
Figure 1 Correlation between gestational age and cumulative furosemide doses. The observations are represented by blue circles. The diagonal line represents the line of best fit.
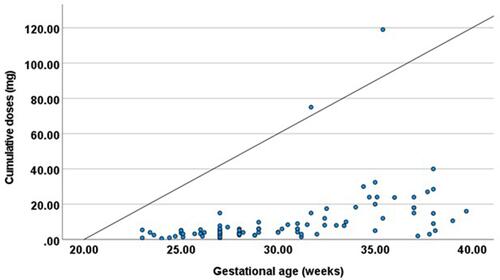
Figure 2 Cumulative furosemide doses according to gestational age categories. The boxplots represent the cumulative doses administered in each gestational age categories. The two horizontal lines above and below the boxes represent the upper and lower limit of ranges. The asterisk points represents the extreme values.
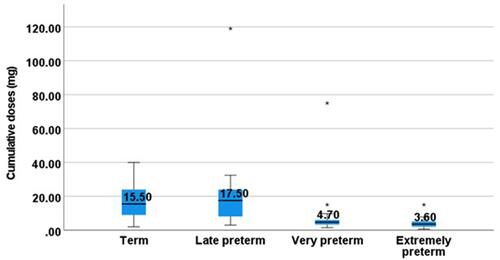
Figure 3 Cumulative furosemide dose adjusted to body-weight according to gestational age categories. The boxplots represent the cumulative dose adjusted to body-weight administered in each gestational age categories. The two horizontal lines above and below the boxes represent the upper and lower limit of ranges. The asterisk points represents the extreme values.
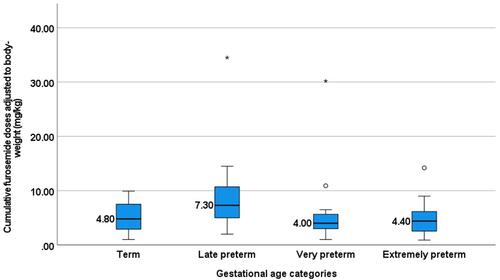
Figure 4 Furosemide dose per kilogram body weight according to gestational age categories. The boxplots reveal the daily per kilogram dose of furosemide in the study participants. The two horizontal lines above and below the boxes represent the upper and lower limit of ranges. The circles and asterisk points represents the extreme values.
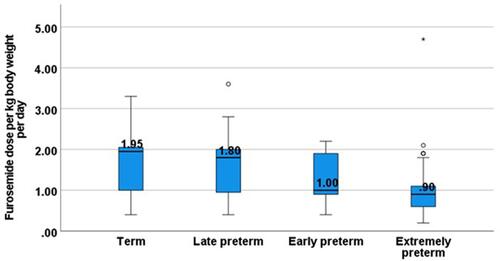
Table 2 Baseline Clinical and Laboratory Parameters of the Study Participants (N = 90)
Figure 5 Percent changes in the clinical and laboratory parameters from baseline. The individual observations are represented by the colored circles.
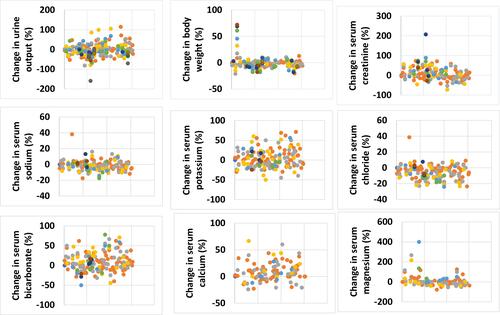
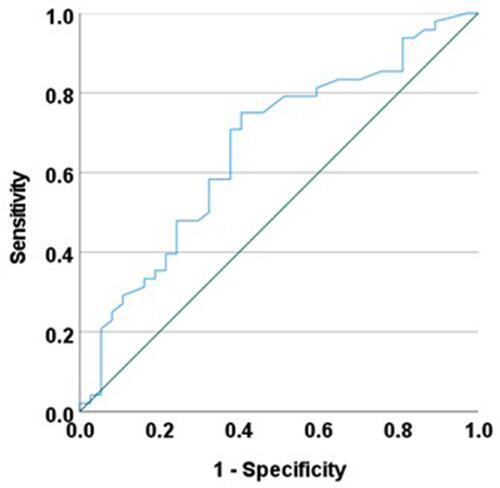
Figure 6 ROC curve for predictive accuracy of the cumulative furosemide doses with electrolyte disturbances. The green diagonal line is the reference line, and the blue line indicates the area for the predictive ability of cumulative dose for electrolyte disturbances.