
Figures & data
Figure 1 Flow diagram.
Abbreviations: AKI, acute kidney injury; CSA-AKI, cardiac surgery associated acute kidney injury; POD, post-operative day.
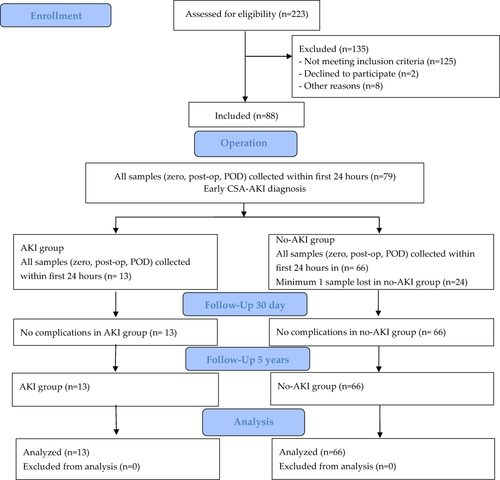
Table 1 Demographic Data and Co-Morbidities of the Study Population
Figure 2 The comparison of NAG (A), ASA (B) and B-GR (C) activity in pre-defined time-points among the AKI group and no-AKI group.
Abbreviations: AKI, acute kidney injury; ASA, lysosomal arylsulfatase A; B-GR, beta-glucuronidase; NAG, N-acetyl-beta-glucosaminidase; POD, post-operative day.
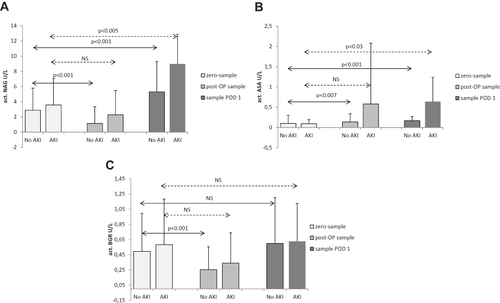
Table 2 Peri-Operative Values of Urine and Serum Parameters in the Study Population
Table 3 The Kinetics of Each Enzyme Regarding Long Term Follow Up