
Figures & data
Figure 1 The image of trigeminal ganglion block and trigeminal ganglion compression. (A) Trigeminal ganglion block was performed under radiation. (B) The inflated balloon compressed the trigeminal ganglion.
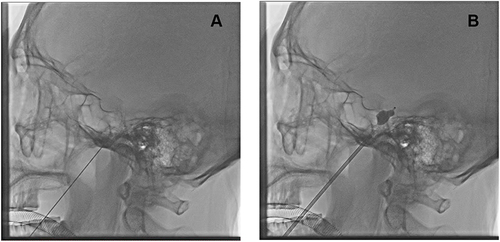
Table 1 Patients’ Characteristics of the Study
Figure 2 The study flow chart.
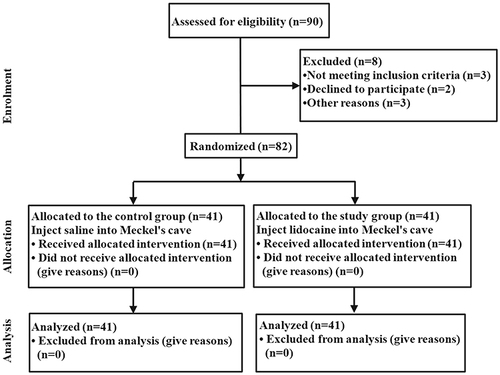
Figure 3 Changes in HR and MAP at seven time-points. (A) HR. (B) MAP. #P<0.05, study group compared with the control group. *P<0.05, T5 and T6 compared with T4.
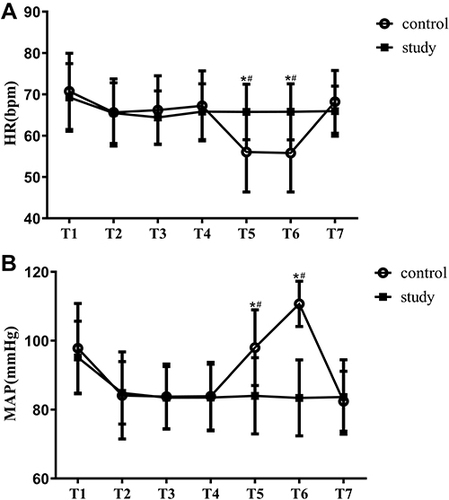
Table 2 The Incidence of Bradycardia in the Control Group and Study Group