
Figures & data
Figure 1 Study flow.
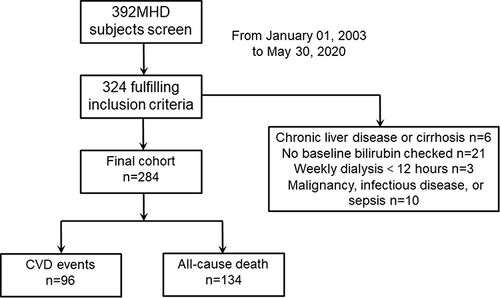
Table 1 Baseline Characteristics of Chronic Hemodialysis Patients Classified by the Serum Indirect Bilirubin Median Value
Figure 2 Kaplan–Meier analysis curves for cardiovascular events in two groups (I1 group with serum IBIL<3.0 μmol/L, I2 group with serum IBIL≥3.0 μmol/L. The Log rank test showed a significant difference between the two groups (P < 0.001). Symbols are: I1 ̶̶̶; I2 ̶̶̶.
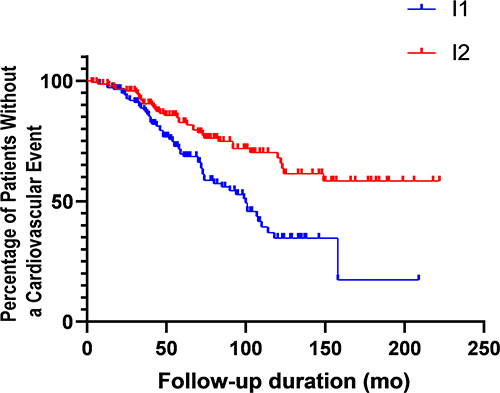
Figure 3 Kaplan–Meier analysis curves for all-cause mortality in two groups (I1 group with serum IBIL<3.0 μmol/L, I2 group with serum IBIL≥3.0 μmol/L. The Log rank test showed no significant difference between the two groups (P =0.428). Symbols are: I1 ̶̶̶; I2 ̶̶̶.
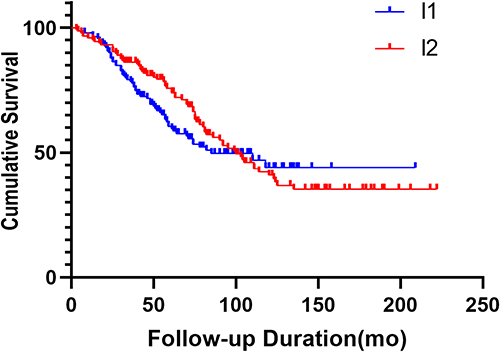
Table 2 Risk Factors for Cardiovascular Events by the Cox Proportional Hazards Analysis in Maintenance Hemodialysis Patients
Table 3 The Relationship Between Cardiovascular Events and the Baseline Serum Indirect Bilirubin by Multiple Cox Analysis