Figures & data
Table 1 Summary of baseline demographic characteristics in the study population of healthy male volunteers
Figure 1 Mean concentration-time profiles in plasma following the oral administration of 15 mg tablets of branded Mobic (•) or generic Meloxicam Hexal (□) formulation to healthy volunteers. Each point represents the geometric mean (95% confidence interval in vertical lines).
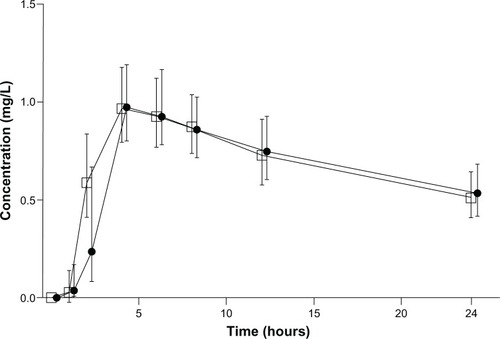
Table 2 Values of plasma pharmacokinetic parameters obtained from the study population of healthy male volunteers (n = 24) following the administration of generic (Meloxicam Hexal) and branded (Mobic) meloxicam formulations
Table 3 Values of the ratios of AUC0–5, AUC0–24, AUC0–inf, and Cmax with 90% confidence intervals
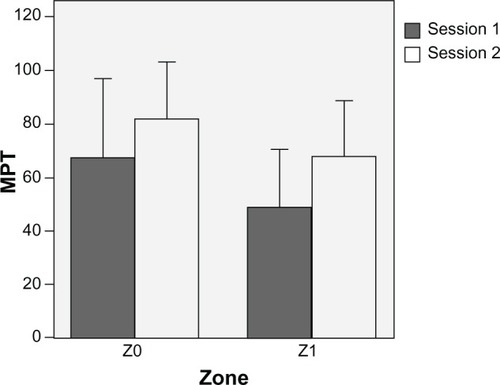
Figure 2 Mechanical pain threshold (MPT) at 5 hours determined by a von Frey device over the two sessions on control (Z0) and hyperalgesic (Z1) skin zone. Each session was performed according to the crossover study design (period 1 and period 2). Data are expressed as means ± standard deviation (vertical lines).