Figures & data
Figure 1 Multi-state model for pwCF: arrows denote direction of transition probabilities (T): from alive without LTx to alive with LTx (T1) or to death (T2); and from alive with LTx to death (T3).
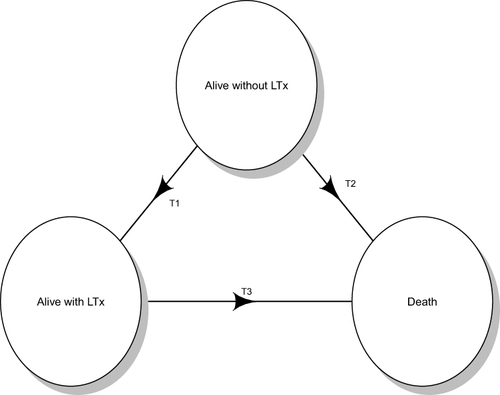
Table 1 Main Demographic and Clinical Characteristics of the 48,343 Considered pwCF
Figure 2 Percentage of pwCF on OT, stratified by year of follow-up, age class and economic status. Low income: Albania, Armenia, Bulgaria, Czech Republic, Greece, Croatia, Hungary, Latvia, Lithuania, North Macedonia, Republic of Moldova, Poland, Portugal, Romania, Russian Federation, Serbia, Slovak Republic, Slovenia, Turkey, Ukraine; high income: Austria, Belgium, Denmark, France, Germany, Ireland, Israel, Italy, Luxembourg, The Netherlands, Norway, Spain, Sweden, Switzerland, United Kingdom.
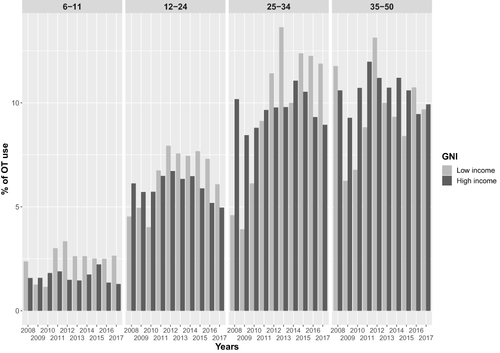
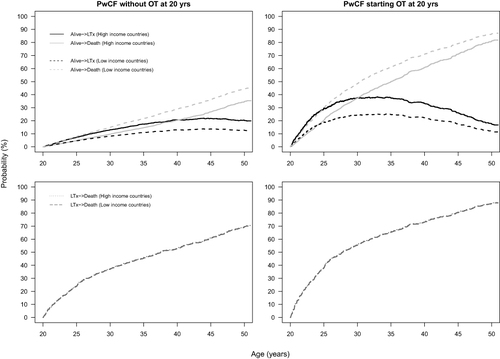
Figure 3 Probabilities of moving from state 1 (alive without LTx) to state 2 (alive with LTx) or state 3 (death) (upper panels) and probabilities for pwCF moving from state 2 to state 3 (lower panels), according to treatment with supplemental oxygen in pwCF at 20 years of age. Adjusting covariates are held constant at the most frequent occurrence.
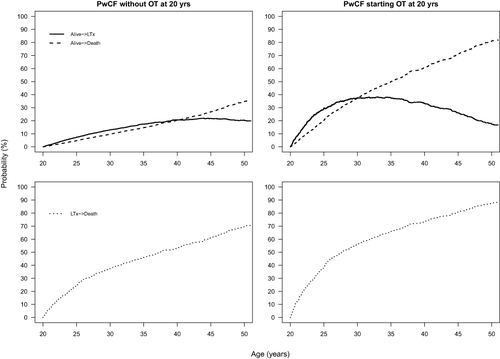
Table 2 Adjusted Hazard Ratio (HR) for the Transition Probabilities from the Multi-State Model
Figure 4 Probabilities to move from state 1 (alive without LTx) to state 2 (alive with LTx) or state 3 (death) (upper panels) and probabilities for pwCF to move from state 2 to state 3 (lower panels), according to GNI in pwCF at 20 years of age. Adjusting covariates are held constant at the most frequent occurrence.