Figures & data
Table 1 Characteristics of Subjects Categorized by the UACR
Figure 1 The distributions of the NLR and PLR among the three groups. (A) The distributions of the NLR among the three groups. (B) The distributions of the PLR among the three groups. NLR and PLR increased with increasing albuminuria (all p<0.001).
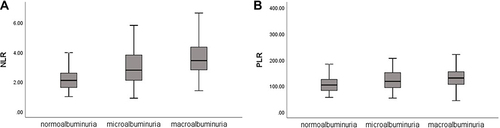
Table 2 Pearson’s Correlation Analysis Between NLR, PLR and Renal Function Indexes
Figure 2 Relationship between NLR, PLR and renal function indexes. Relationship between NLR and UACR (A), between NLR and eGFR (B), between PLR and UACR (C), between PLR and eGFR (D).
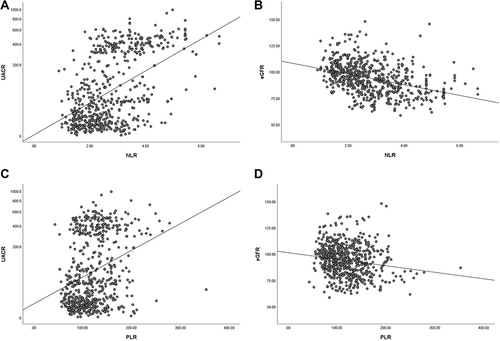
Table 3 Risk Factors for DKD in Patients with Type 2 Diabetes
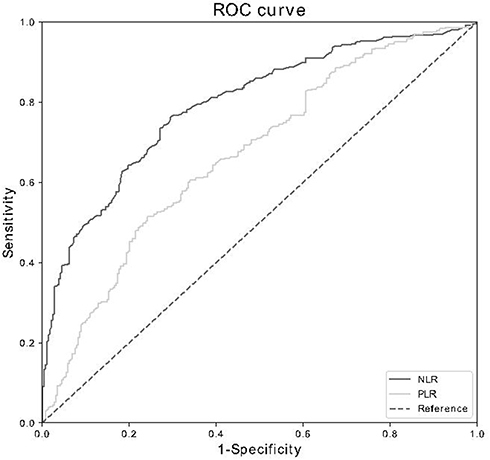
Figure 3 Receiver operating characteristic (ROC) curve analysis of NLR and PLR for DKD prediction.