Figures & data
Table 1 Analysis of Differences in Baseline Data Between Patients with and without Bone Grafting (n=65)
Table 2 Changes in Clinical and Radiological Outcomes
Figure 1 Display of osteotomy area in anterior and posterior position by three-dimensional CT after operation. (a) Postoperative CT showed that the osteotomy space was filled with allograft bone. (b) The opening width of the osteotomy gap was < 10mm confirmed by postoperative CT measurement.
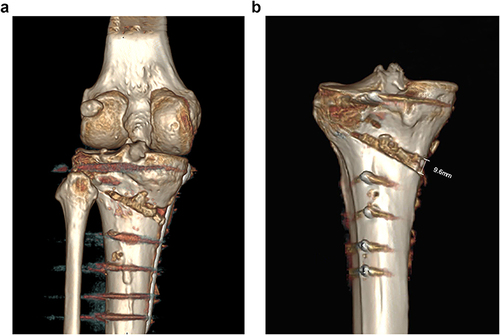
Figure 2 The osteotomy space was divided into the lateral hinge and four equally spaced intervals on the medial-lateral radiograph of the knee joint.
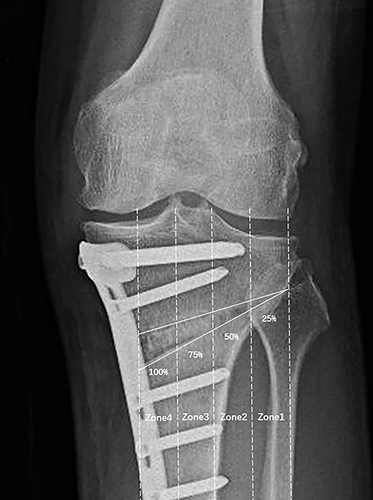
Figure 3 The result of (Line A/ Line B) × 100 was the rate of osteotomy gap union.
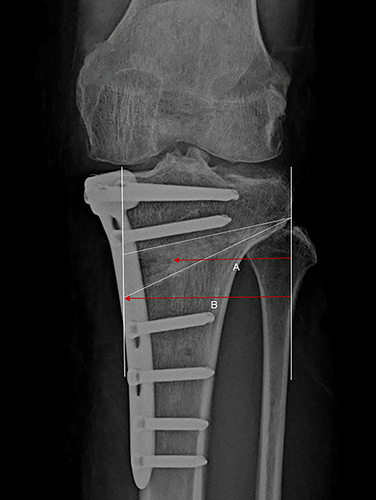
Table 3 Location of Union Zone of Osteotomy Gap at Different Follow-Up Time Post-Operatively
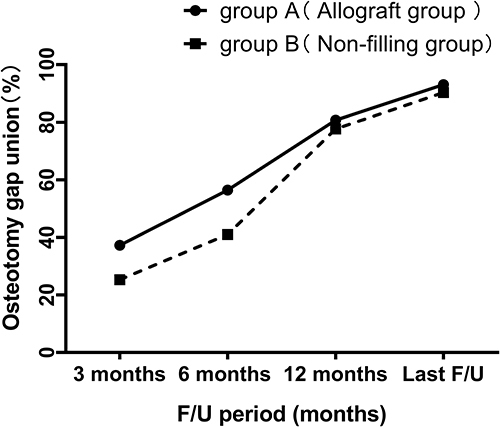
Table 4 Differences in Rates of Osteotomy Gap Union Between the Two Groups at Different Follow-Up Times After Surgery (n=65)
Table 5 Multiple Linear Regression Analysis of Factors Influencing Union Rate of Osteotomy at 6 Months Post-Operatively
Table 6 Multiple Linear Regression Analysis of Factors Influencing Union Rate of Osteotomy at the Last Follow-Up
Figure 4 The radiological union rate between group A and group B at different periods.