Figures & data
Table 1 Comparisons of Demographic and Clinical Characteristics Between Recipients with AMR and Controls
Figure 1 Differences in intestinal metabolic profiles among the KT-AMR, KT-SRF, and ESRD groups. (A) PCA score plots in the ESI+ mode; (B) PCA score plots in the ESI- mode; (C) OPLS-DA score plots in the ESI+ mode (KT-AMR vs ESRD); (D) OPLS-DA score plots in the ESI+ mode (KT-AMR vs KT-SRF); (E) OPLS-DA score plots in the ESI+ mode (KT-SRF vs ESRD); (F) OPLS-DA score plots in the ESI- mode (KT-AMR vs ESRD); (G) OPLS-DA score plots in the ESI- mode (KT-AMR vs KT-SRF); (H) OPLS-DA score plots in the ESI- mode (KT-SRF vs ESRD).
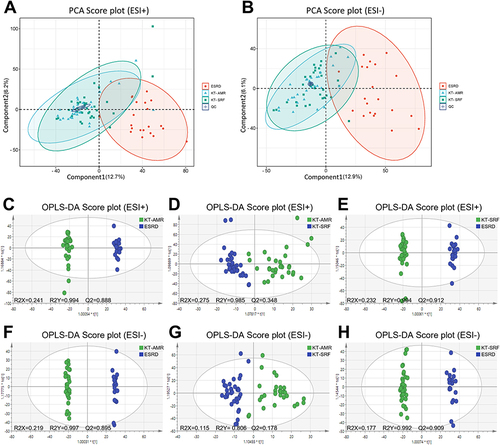
Figure 2 Differential intestinal metabolites among the KT-AMR, KT-SRF, and ESRD groups. (A) Wayne figures of overlapping and different metabolites among groups; (B) the heatmap of 14 differential intestinal metabolites in both the ESRD group and the KT-SRF group compared the KT-AMR group.
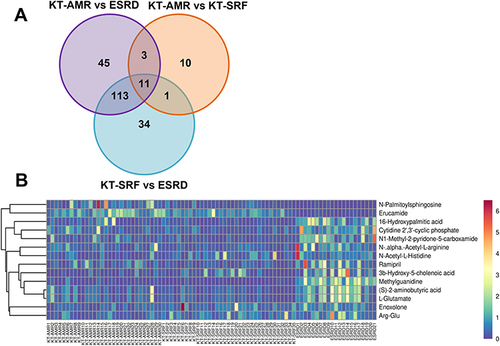
Figure 3 Receiver operating characteristic (ROC) curves of potential metabolic biomarkers. (A) ROC curves of metabolites to discriminate between the KT-AMR and ESRD groups; (B) ROC curves of metabolites to discriminate between the KT-AMR and KT-SRF groups; (C) ROC curves of the combination of metabolic biomarkers using logistic regression models to discriminate between the KT-AMR and KT-SRF groups; (D) ROC curves of metabolites to discriminate between the KT-SRF and ESRD groups.
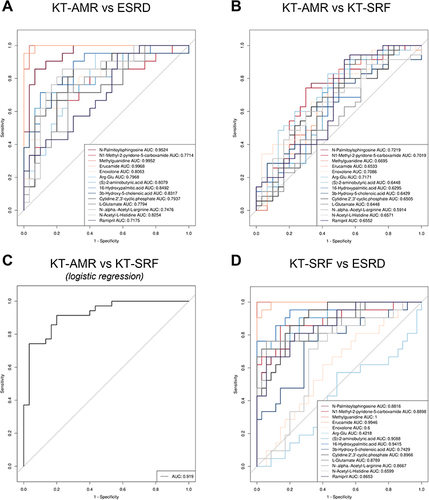
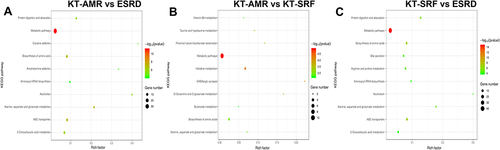
Figure 4 Metabolic pathway enrichment analysis. The top 10 enrichment pathways were represented by bubble charts. (A) ROC curves of microbial biomarkers. (A) Pathway enrichment analysis of differential metabolites between the KT-AMR and ESRD groups; (B) pathway enrichment analysis of differential metabolites between the KT-AMR and KT-SRF groups; (C) pathway enrichment analysis of differential metabolites between the KT-SRF and ESRD groups.