
Figures & data
Table 1 Lane Sandhu Score
Table 2 Distribution (Absolute and in %) of the ASA-Score in the Treated Groups
Figure 1 (A–C) Distribution (absolute) of localizations of non-unions in the treated groups.
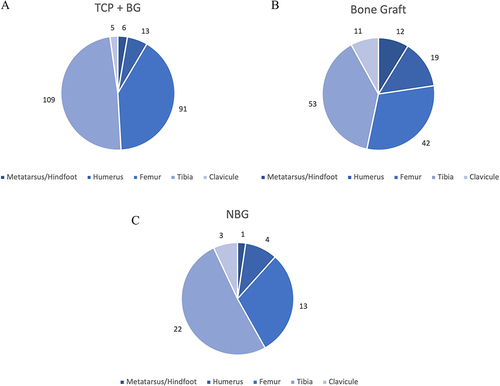
Table 3 Distribution (Absolute and in %) of the Lane Sandhu Score After 1 Year in the Treated Group
Table 4 Distribution (Absolute and in %) of the Stability After 1 Year in the Treated Groups
Table 5 Distribution (Absolute and in %) of the Lane Sandhu Score After 2 Years in the Treated Groups
Table 6 Distribution (Absolute and in %) of the Stability After 2 Years in the Treated Groups
Table 7 Binomial Regression Results for the Effect of Patient-Individual Factors/Secondary Parameters After 1 Year
Table 8 Binomial Regression Results for the Effect of Patient-Individual Factors/Secondary Parameters After 2 Years