Figures & data
Figure 1 Upper abdominal sonographic image showing an empty stomach antrum. Antrum is pointed out by 4 x’s corresponding to its 2 perpendicular diameters.
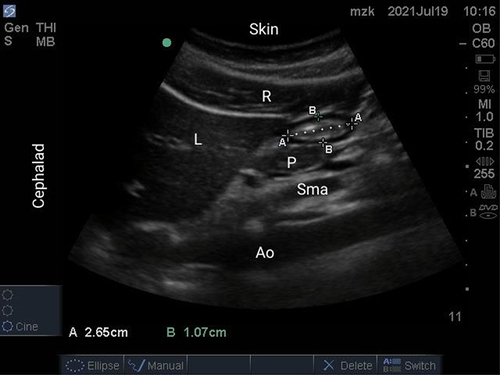
Figure 2 Gastric ultrasound performed based on the qualitative 3-point grade assessments. Antrum is pointed out by 4 x’s corresponding to its 2 perpendicular diameters. (A) The empty antrum (Grade 0) in the semi-recumbent (A1) and right lateral decubitus (A2) positions appear small and “flat”. (B) The antrum with minimal, insignificant amount of fluid (Grade 1), a small amount of fluid is detectable only in the right lateral decubitus position (B2). (C) The antrum with significant fluid content (Grade 2), fluid is evident in both positions, but more marked in the right lateral decubitus position (C2).
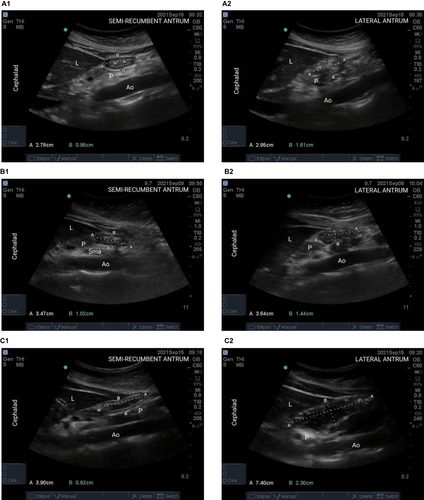
Table 1 Patient Demographics, Gastric Ultrasound Examination, and Gastric Fluid Volume Data
Figure 3 Flow chart of the study. RLD represents right lateral decubitus.
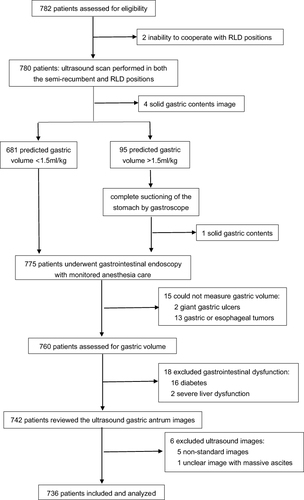
Figure 4 Receiver operating characteristic curves for the ultrasonographic diagnosis of risk stomach, as defined by a suctioned fluid volume of gastric contents > 1.5 mL/kg of antral CSA in patients with RLD (A) and semi-recumbent positions (B), and defined by a suctioned fluid volume of gastric contents > 100 mL of antral CSA in patients with RLD (C) and semi-recumbent positions (D).
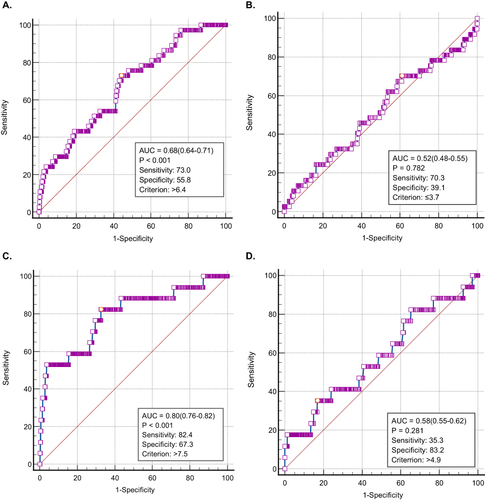
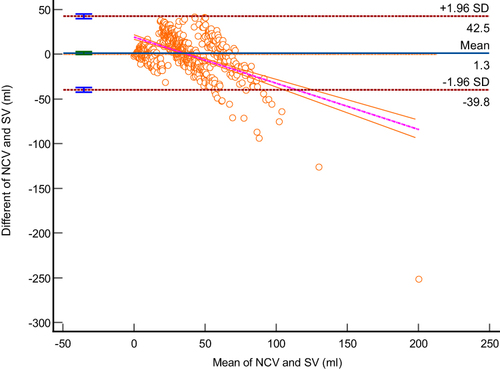
Figure 5 Bland–Altman analysis demonstrates the agreement between the current calculated volume (CCV) according to mathematical Model (2) and the suctioned volume (SV) through gastroscopy. The y-axis represents the difference between the two values (CCV-SV), and the x-axis represents the mean between the two values (CCV+SV/2). The Orange dotted line (inner dotted lines) represents perfect agreement. The blue solid line is the mean difference or “bias” of the model. The outer dotted lines represent the upper and lower limits of 95% agreement.
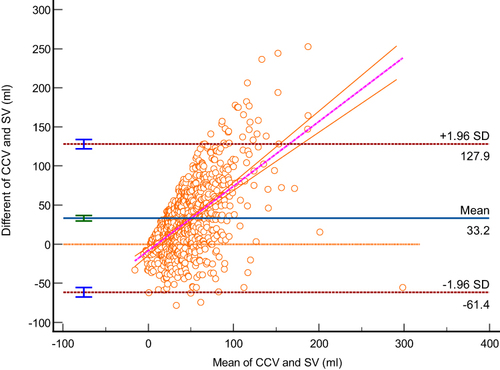
Table 2 Correlation Analysis Between Gastric Volume and Independent Variables
Figure 6 Bland–Altman analysis demonstrates the agreement between the new calculated volume (NCV) according to mathematical Model (3) and the suctioned volume (SV) through gastroscopy. The y-axis represents the difference between the two values (NCV-SV), and the x-axis represents the mean between the two values (NCV+SV/2). The blue solid line is the mean difference or “bias” of the model. The outer dotted lines represent the upper and lower limits of 95% agreement.