Figures & data
Figure 1 Design of study RTG114137.
Abbreviation: PK, pharmacokinetics.
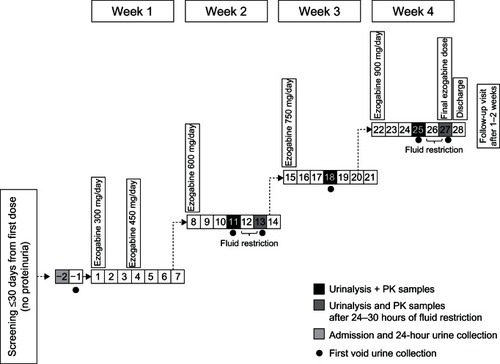
Table 1 Incidence of urinalysis abnormalities in Study 303
Table 2 Baseline demographic characteristics for Study RTG114137
Table 3 Incidence of urinalysis abnormalities in Study RTG114137
Figure 2 Effect of fluid restriction on the density of urine from healthy volunteers receiving ezogabine in Study RTG114137.
Abbreviation: SD, standard deviation.
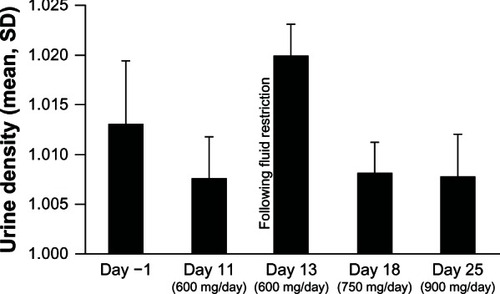
Table 4 Adverse events occurring in ≥2 subjects by ezogabine dose for Study RTG114137