Figures & data
Table 1 Topics investigated to identify the current provision of sedation among general dental practitioners (GDPs) and specialist dental practitioners in Jordan in 2010
Table 2 Respondents’ demographic characteristics
Table 3 Respondent practitioners performing sedation in their practices classified by year of qualification (absolute number of respondent practitioners per category or subcategory [%])
Table 4 Comparison between the percentages of general dental practitioners (GDPs) and specialist dental practitioners (SDPs) performing sedation in their practices classified by year of qualification (% followed by absolute number of respondent practitioners per category or subcategory in parentheses)
Table 5 Statistical significance in the difference between the percentages of specialist dental practitioners performing sedation in their practices classified by year of qualification
Table 6 Distribution of workplace for all specialist dental practitioners (SDPs) performing sedation in their practices (absolute number of respondent practitioners per category or subcategory [%])
Table 7 Reasons for not performing sedation, as reported by respondent practitioners not performing sedation in their practices (absolute number of respondent practitioners per category or subcategory [%])
Figure 1 Practitioners’ responses (general dental practitioners and specialist dental practitioners practicing sedation) to four questions dealing with some issues of the standards of care related to conscious sedation (n = 73).
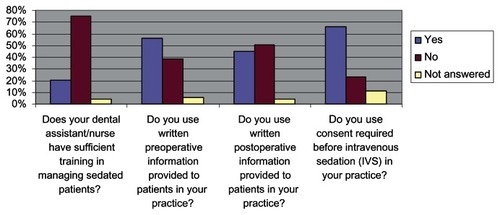
Figure 2 Distribution of cases treated in the last year by type of practice (n = 3745).
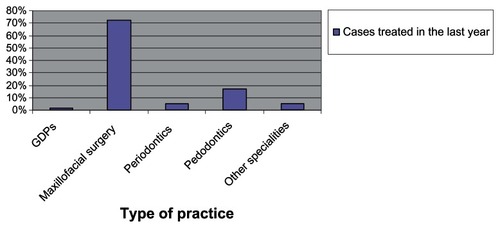
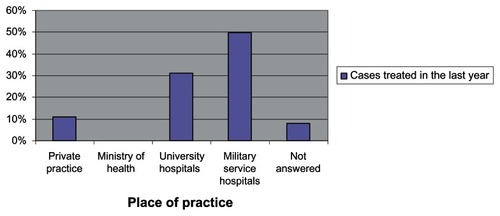
Figure 3 Distribution of cases treated in the last year by place of practice (n = 3745).