
Figures & data
Figure 1 Flow chart of study design.
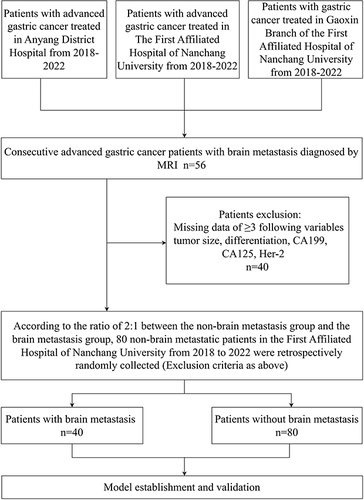
Table 1 Univariate Analysis of Clinicopathological Characteristics
Table 2 Univariate Logistic Hazardsregression Analysis
Figure 2 A nomogram integrated with nine risk factors to predict the possibility of brain metastasis. The nomogram was used by adding up the points identified on the points scale for each variable.
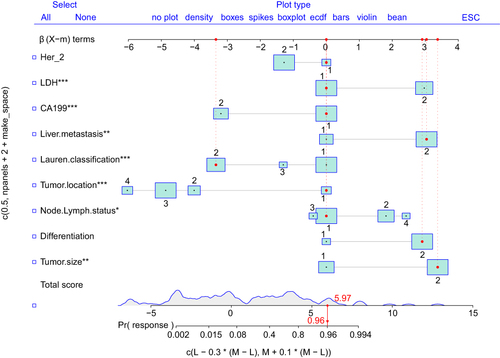
Figure 3 Validation of the brain metastasis nomogram using ROC and cut-off value determined by ROC. (a) The y-axis indicates the specificity of the risk prediction, while the x-axis indicates the sensitivity. (b) When 1.28 was set as the cut-off value determined by ROC analysis and Youden index, nomogram had the best sensitivity and specificity. (c) Regression coefficients corresponding to each variable in the multivariate regression analysis.
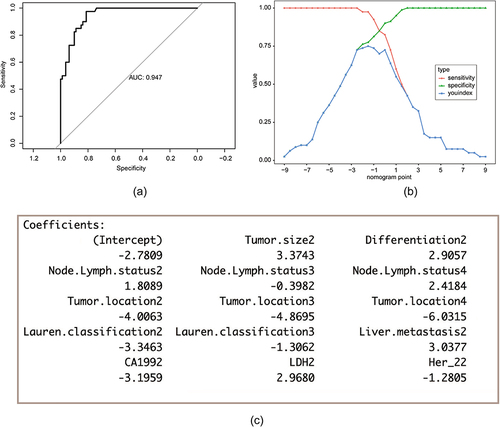
Figure 4 Sensitivity and specificity for predicting brain metastasis of nomogram and other single variables was compared by the area under curve (AUC).
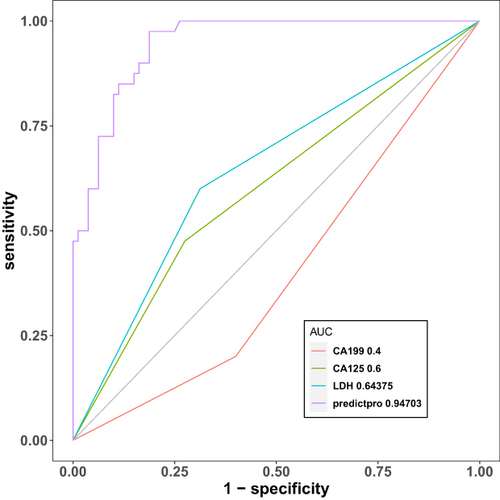
Figure 5 Calibration and repeatability validation of model. (a) Calibration curve for nomogram-predicted and actual probability of having brain metastasis. (b) Boootstrap resampling to realize the confidence interval of the brain metastasis prediction nomogram.
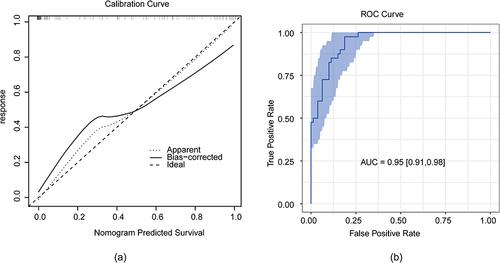
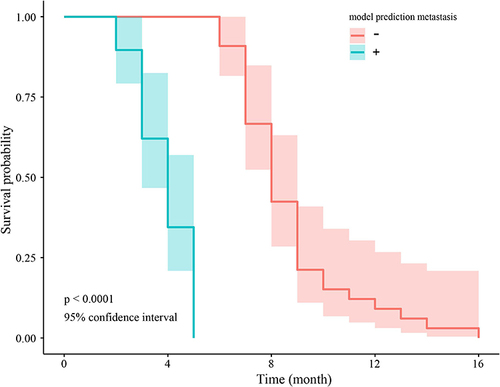
Figure 6 OS for brain metastasis and non-brain metastasis predicted by nomogram.
Data Sharing Statement
The data are not available to the general public due to the regulations of our institution, but they are available to researchers on reasonable request by emailing Li Zhang ([email protected])