
Figures & data
Table 1 Postoperative Complications After Pericardiectomy
Figure 1 Analysis of the diagnostic value of coagulation indicators for postoperative complications. (A) ROC curve analysis of the diagnostic value of DD; (B) ROC curve analysis of the diagnostic value of APTT; (C) ROC curve analysis of the diagnostic value of PT; (D) ROC curve analysis of the diagnostic value of INR; (E) ROC curve analysis of the diagnostic value of TT; (F) ROC curve analysis of the diagnostic value of FBG.
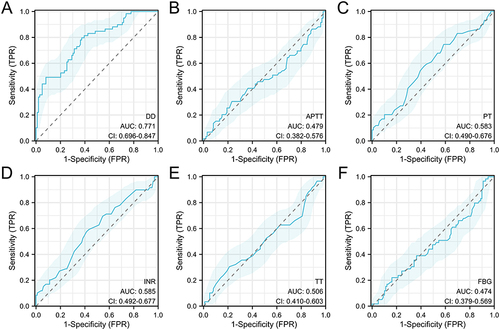
Figure 2 Analysis of the diagnostic value of D-dimer for different postoperative complications. (A) ROC curve analysis of the diagnostic value for cardiac complications; (B) ROC curve analysis of the diagnostic value for pulmonary complications; (C) ROC curve analysis of the diagnostic value for acute liver or kidney injury; (D) ROC curve analysis of the diagnostic value for deep vein thrombosis.
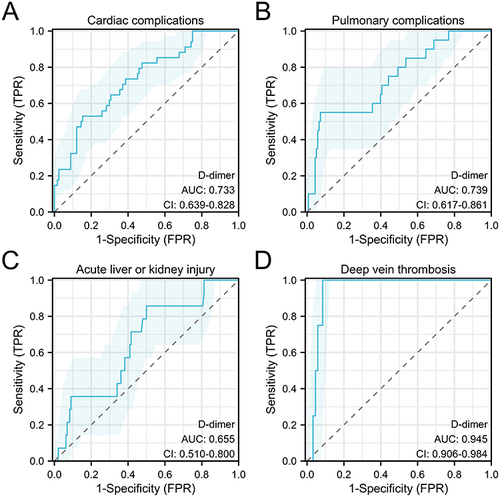
Table 2 Preoperative Baseline Characteristics of the Patients
Table 3 Comparison of Postoperative Outcomes
Table 4 Effect of Preoperative DD Level on Postoperative Complications
Data Sharing Statement
The datasets used and/or analyzed during the current study are available from the corresponding author on reasonable request.