Figures & data
Table 1 Clinical Characteristics of the Analyzed Population
Table 2 NLR, MLR and PLR Values in the Analyzed Population
Table 3 Spearman Correlation Analysis Between Quantitative Variables and NLR, MLR and PLR Values in the Study Population
Table 4 NLR, MLR and PLR Values Depending on the Occurrence of Conversion
Table 5 The Relationship Between the Grade of Postoperative Complications and the NLR, MLR and PLR Values
Figure 1 The relationship between the grade of postoperative complications and the NLR value.
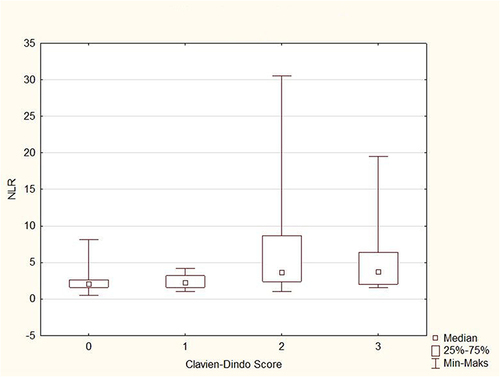
Figure 2 The relationship between the grade of postoperative complications and the MLR value.
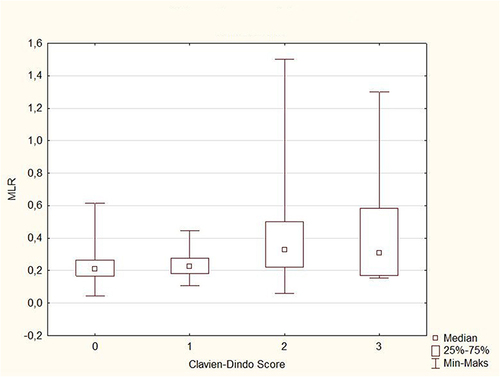
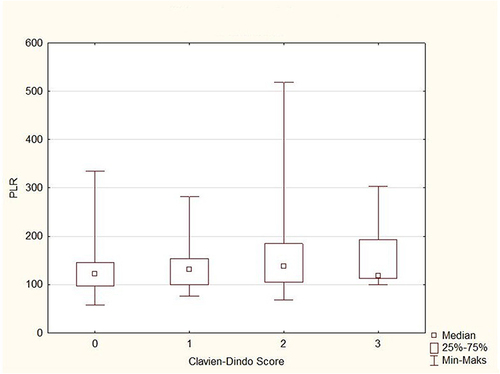
Figure 3 The relationship between the grade of postoperative complications and the PLR value.