99
Views
26
CrossRef citations to date
0
Altmetric
Original Research

Significance of the prognostic nutritional index in patients with esophageal squamous cell carcinoma

&
Pages 1-7 | Published online: 16 Dec 2013

Figures & data

Figure 1 Scatter plot of PNI on the x-axis versus Martingale residuals (n=375). Patients above the horizontal line (zero) were at an increased risk for death compared with the expected risk from the Cox proportional hazards regression model. The curved line represents a smoother scatter plot. The point at which the smoother line crosses the horizontal line (zero) occurs at 42, indicating that this would be the best cut-off point to predict death from esophageal squamous cell carcinoma based on PNI. The point at which the curve line crosses the horizontal line (zero) is at a PNI of 52, indicating that this would be another cut-off point. With the help of the fit line on the scatter plot, we classified the patients into three categories according to PNI, ie, <42, 42–52, and >52.

Abbreviation: PNI, prognostic nutritional index.
Figure 1 Scatter plot of PNI on the x-axis versus Martingale residuals (n=375). Patients above the horizontal line (zero) were at an increased risk for death compared with the expected risk from the Cox proportional hazards regression model. The curved line represents a smoother scatter plot. The point at which the smoother line crosses the horizontal line (zero) occurs at 42, indicating that this would be the best cut-off point to predict death from esophageal squamous cell carcinoma based on PNI. The point at which the curve line crosses the horizontal line (zero) is at a PNI of 52, indicating that this would be another cut-off point. With the help of the fit line on the scatter plot, we classified the patients into three categories according to PNI, ie, <42, 42–52, and >52.

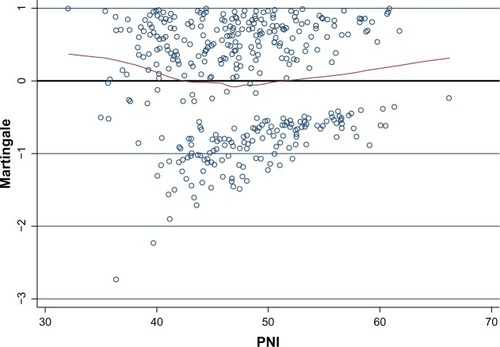
Table 1 Baseline characteristics of 375 patients with ESCC

Table 2 Relationship between PNI and clinicopathological characteristics

Figure 2 Kaplan–Meier survival curves stratified by PNI.

Notes: The 5-year CSS in patients with PNI <42, 42–52, and >52 was 11.0%, 39.1%, and 55.2%, respectively (P<0.001). Thus, the PNI was able to clearly classify such patients into three independent groups.
Abbreviations: CSS, cancer-specific survival; PNI, prognostic nutritional index.
Figure 2 Kaplan–Meier survival curves stratified by PNI.

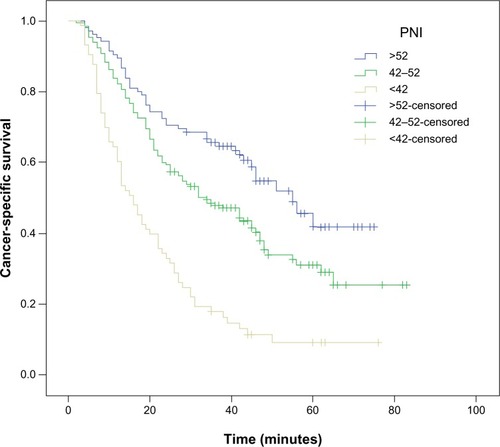
Table 3 Univariate and multivariate analyses in patients with ESCC