
Figures & data
Table 1 Patient characteristics
Table 2 Frequency distribution of historical variables at the time of hospital admission (case history)
Figure 1 Classification and regression tree classification for type of infection
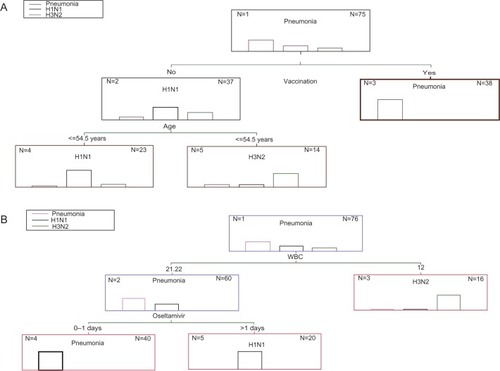
Table 3 Classification and regression trees classification matrix for the dependent variable “type of infection,” showing the percentage of fit and misfit values between the observed and predicted frequencies as distributed in the three categories: 0 (pneumonia), 1 (H1N1), and 2 (H3N2) (case history)
Table 4 Frequency distribution and pathogenic threshold levels of the instrumental variables as assigned by the four combined categories (instrumental measurements)
Table 5 Chi-squared automatic interaction detector classification matrix for the dependent variable “type of infection,” showing the percentage of fit and misfit values between the observed and predicted frequencies as distributed in the three categories: 0 (pneumonia), 1 (H1N1), and 2 (H3N2) (instrumental measurements)
Table 6 Frequency distribution of clinical symptoms
Figure 2 Two-dimensional arrangement of symptoms and infection type according to multiple correspondence analysis.
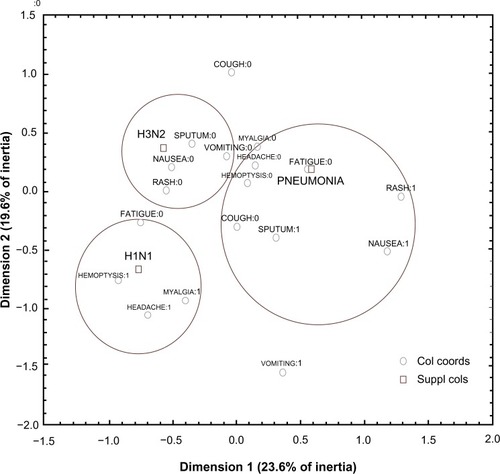
Table 7 Standardized deviates of infection type produced by the multiple correspondence analysis