Figures & data
Figure 1 Standard chest X-ray on admission.
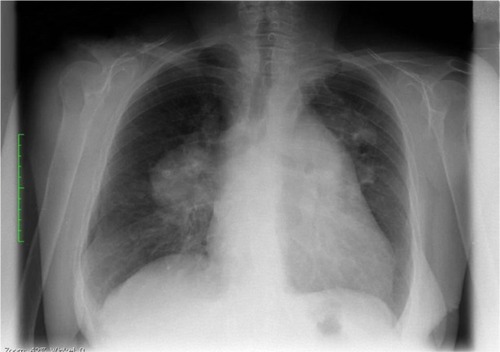
Figure 2 Esophageal ultrasound.
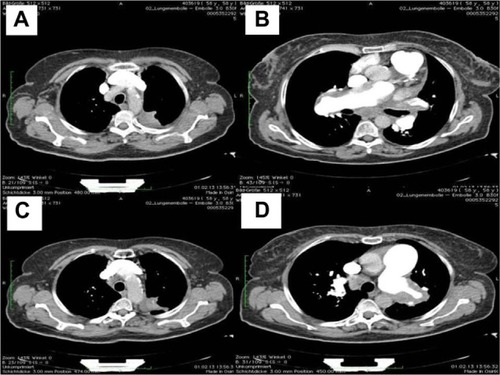
Figure 3 Maximum intensity projection view.
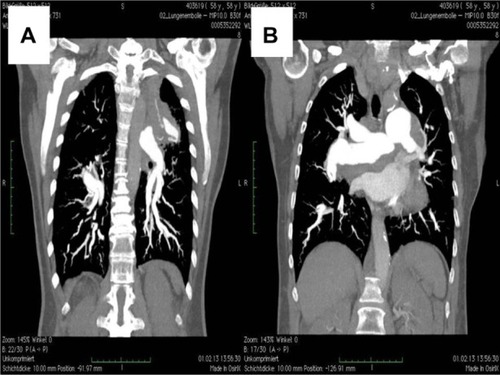
Figure 4 Magnetic resonance imaging.
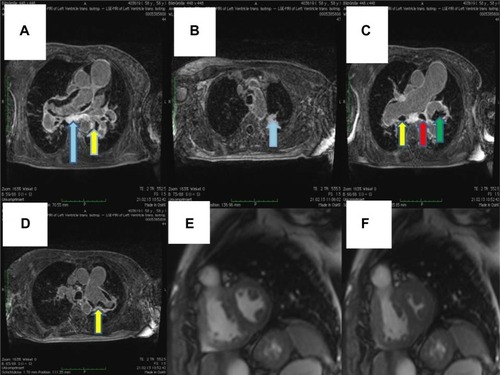
Figure 5 Lung biopsy showing increased interstitial collagen (⇦ blue), elastic fibers (a gray), activated pneumocytes (➞), and pathological vessels with thickened walls. ☆ 100×.
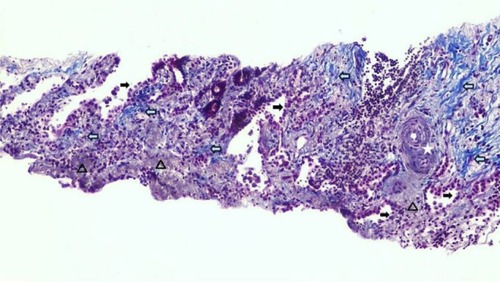
Figure 6 Lung biopsy with increased interstitial collagen (red) and elastic fibers (blue), Activated pneumocytes➞, Pathologic vessels with thick walls. ☆ evaluation of vessel invasion, 100×.
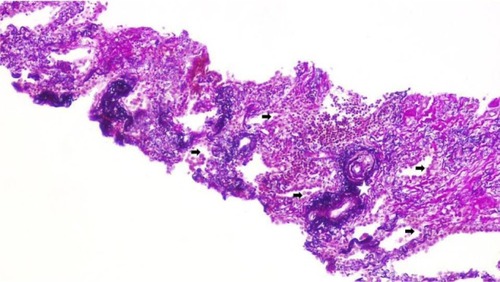
Figure 7 Lung biopsy with interstitial fibrosis ★ and activated pneumocytes ➞. Hematoxylin and eosin, 100×.
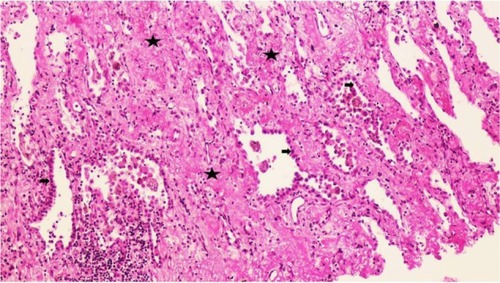
Figure 8 Coronary angiography.
Abbreviations: PA, pulmonary artery; RV, right ventricular.
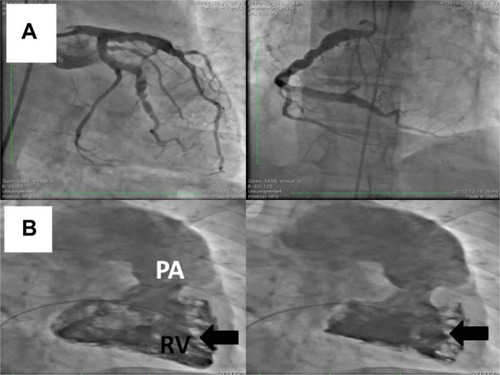
Figure 9 Right sided pulmonary artery angiography performed at Giessen indicating chronic thromboembolic pulmonary hypertension which was also demonstrated by two ventilation/perfusion (V/Q) mismatches.
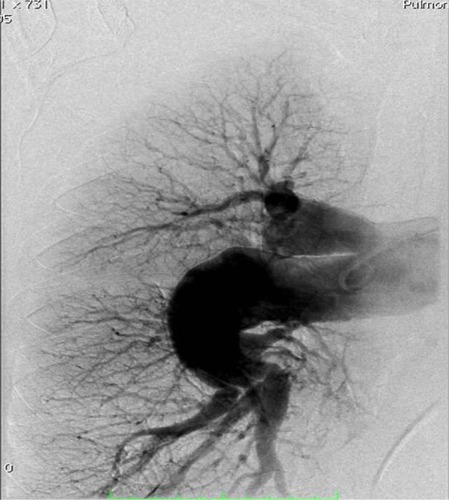
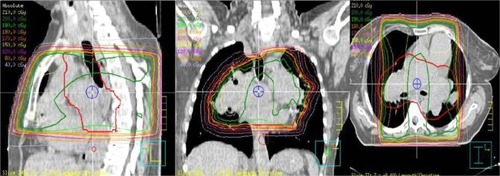
Figure 10 Isodoses clearly showing the main branch of the pulmonary artery with the first segmentation included.