Figures & data
Figure 1 Flow chart of study selection.
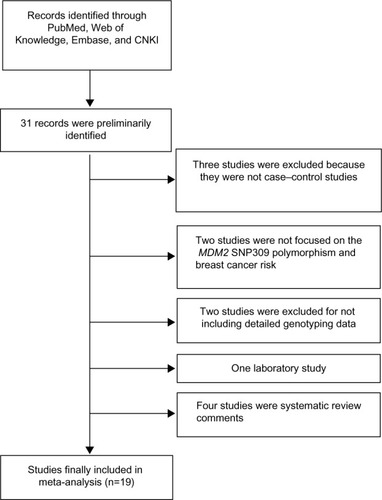
Table 1 Characteristics of the studies included in the meta-analysis
Figure 2 Forest plots of the MDM2 rs 2279744 polymorphism and breast cancer risk in the overall population (TG vs TT).
Abbreviations: CI, confidence interval; OR, odds ratio; df, degrees of freedom; M-H, Mantel-Haenszel; MDM2, mouse double minute 2 homolog.
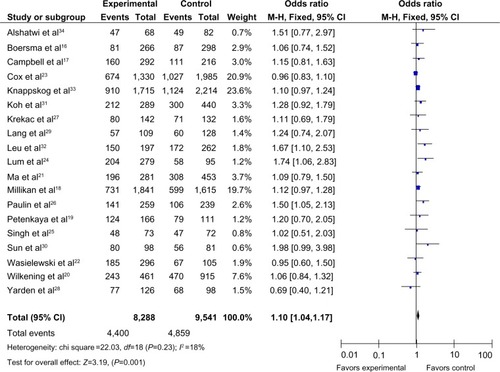
Table 2 Meta-analysis of the association between the MDM2 rs 2279744 polymorphism and breast cancer risk
Figure 3 Forest plots showing the relationship between the MDM2 rs 2279744 polymorphism and breast cancer risk in the Asian subgroup; (A) G vs T; (B) GG vs TT; (C) TG vs TT; (D) TG+GG vs TT.
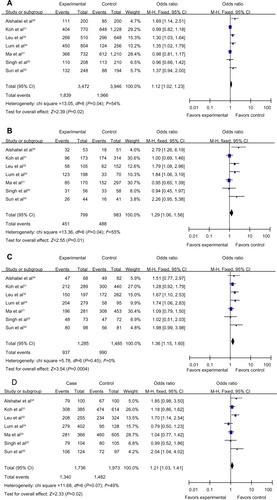
Figure 4 Forest plot showing the relationship between the MDM2 rs 2279744 polymorphism and breast cancer risk in the African subgroup (TG vs TT).
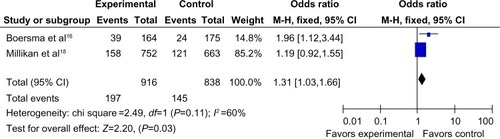
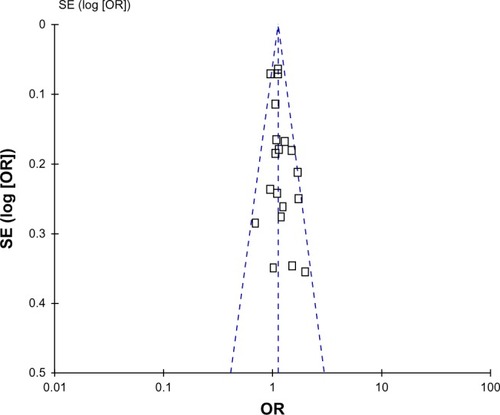
Figure 5 Funnel plot assessing evidence of publication bias from 19 studies (TG vs TT).