Figures & data
Figure 1 Illustration of the synchronous mode of vibration transmission in whole-body vibration exercise. Both legs extend and stretch at the same time, and a purely linear acceleration is directed to the trunk.
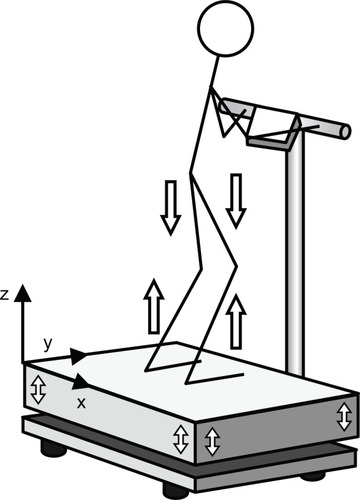
Table 1 Intervention outcomes for energy expenditure and intake, and anthropometry in obese patients with nonalcoholic fatty liver disease
Table 2 Intervention adherence outcomes for blood biochemistry in obese patients with nonalcoholic fatty liver disease
Figure 2 Effects of AT on muscle strength (A), cross-sectional area (B), fat deposition (C) in the femoral muscle (quadriceps), intrahepatocellular lipids measured by magnetic resonance spectroscopy (D), intrahepatocellular lipids measured by Fibroscan 502 (E), and liver stiffness (F) in obese patients with nonalcoholic fatty liver disease.
Abbreviations: AT, acceleration training; IMCL, intramyocellular lipids; EMCL, extramyocellular lipids; IHL, intrahepatic lipids.
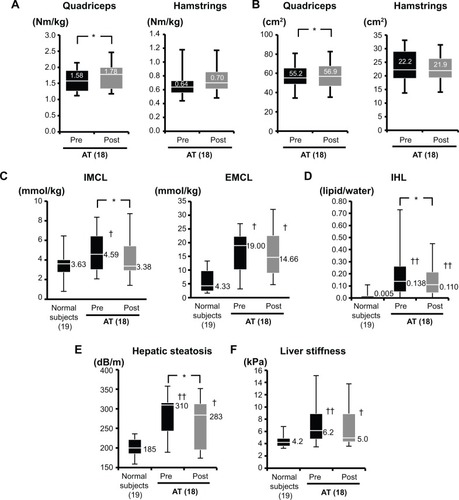
Figure 3 Effects of AT on serum levels of leptin, adiponectin, TNF-α, IL-6 (A), and hs-CRP and TBARS (B) in obese patients with nonalcoholic fatty liver disease.
Abbreviations: AT, acceleration training; TNF-α, tumor necrosis factor-alpha; IL-6, interleukin-6; hsCRP, high-sensitivity C-reactive protein; TBARS, thiobarbituric acid reactive substances.
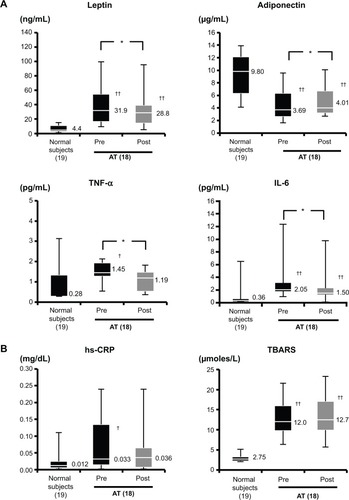
Figure 4 Changes in SF-36 scores prior to and after acceleration training in obese patients with nonalcoholic fatty liver disease.
Abbreviations: BP, bodily pain; GH, general health perception; SF-36, Short Form Health Survey; ER, emotional role; MH, mental health; PF, physical functioning; PR, physical role; SF, social functioning; VT, vitality.
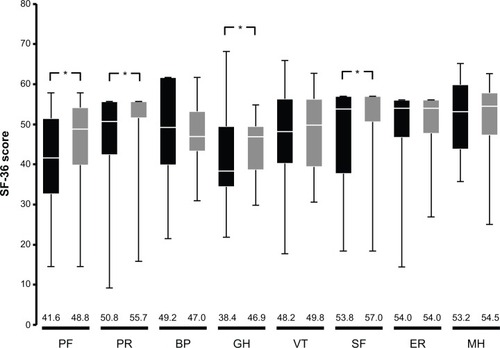
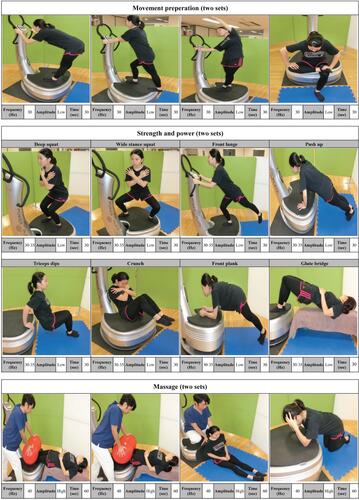
Figure S1 The acceleration training program conducted in this study.