
Figures & data
Figure 1 Flow chart of the meta-analysis.
Abbreviation: CRP, C-reactive protein.
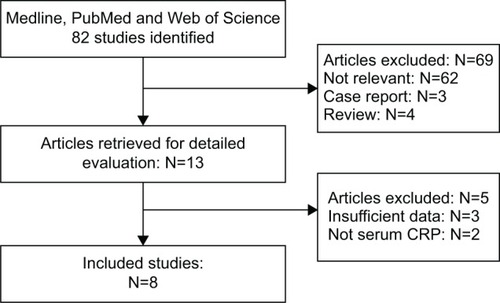
Table 1 Characteristics of included studies
Figure 2 Forest plot of the association between serum CRP and OS in EC.
Abbreviations: CRP, C-reactive protein; OS, overall survival; EC, esophageal cancer; HR, hazard ratio; CI, confidence interval.
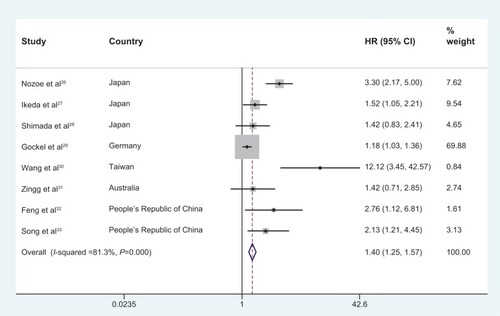
Figure 3 Forest plot of the association between serum CRP and OS in EC by subgroup analyses.
Notes: Subgroup analysis according to treatment (A) surgery only; (B) surgery combined with chemotherapy/radiotherapy, pathological type; (C) squamous cell carcinoma; (D) squamous cell carcinoma, adenocarcinoma and others and cut-off level (E) cut-off =10 mg/L; (F) cut-off =5 mg/L.
Abbreviations: CRP, C-reactive protein; OS, overall survival; EC, esophageal cancer; HR, hazard ratio; CI, confidence interval.
Abbreviations: CRP, C-reactive protein; OS, overall survival; EC, esophageal cancer; HR, hazard ratio; CI, confidence interval.
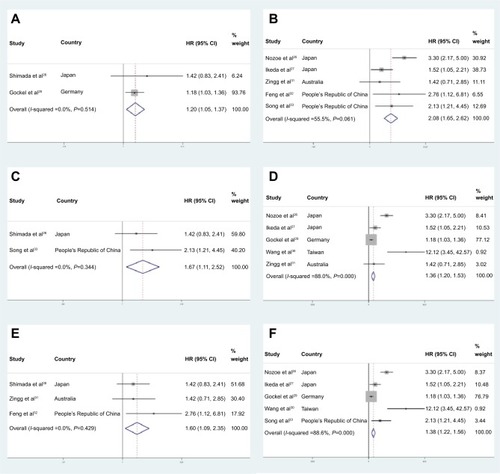
Table 2 Subgroup analyses of pooled HRs for increased serum CRP and OS in EC