
Figures & data
Table 1 Descriptive statistics related to the participants
Figure 1 (A) Venous and capillary glucose level comparability in all patients with normal vital signs and low perfusion index (0–5) (n=67). (B) Venous and capillary glucose level comparability in patients with normal vital signs and high perfusion index (>5) (n=19).
Abbreviations: CGL, capillary glucose level; VGL, venous glucose level; SD, standard deviation.
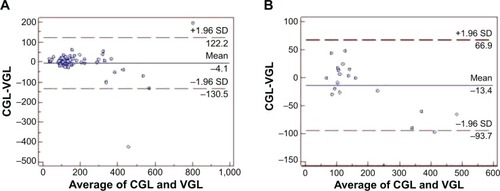
Figure 2 (A) Venous and capillary glucose level comparability in patients with at least one abnormal vital sign finding and low perfusion index (n=131). (B) Venous and capillary glucose level comparability in patients with at least one abnormal vital sign finding and high perfusion index (n=57).
Abbreviations: CGL, capillary glucose level; VGL, venous glucose level; SD, standard deviation.
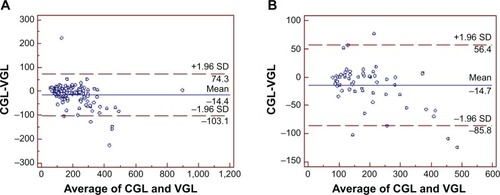
Figure 3 (A) Venous and capillary glucose level comparability in younger patients, aged 18–65 years, with perfusion index between 0 and 5 (n=44). (B) Venous and capillary glucose level comparability in older patients, aged >65 years, with perfusion index between 0 and 5 (n=22).
Abbreviations: CGL, capillary glucose level; VGL, venous glucose level; SD, standard deviation.
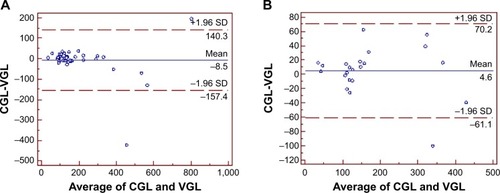
Figure 4 (A) Venous and capillary glucose level comparability in younger patients, aged 18–65 years, with perfusion index >5 (n=12). (B) Venous and capillary glucose level comparability in older patients, aged >65 years, with perfusion index >5 (n=7).
Abbreviations: CGL, capillary glucose level; VGL, venous glucose level; SD, standard deviation.
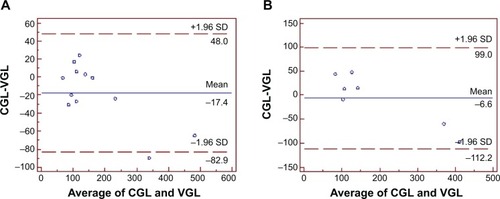
Figure 5 (A) Venous and capillary glucose level comparability in younger patients, aged 18–65 years, with at least one abnormal vital sign finding and low perfusion index (n=72). (B) Venous and capillary glucose level comparability in older patients, aged >65 years, with at least one abnormal vital sign finding and low perfusion index (n=59).
Abbreviations: CGL, capillary glucose level; VGL, venous glucose level; SD, standard deviation.
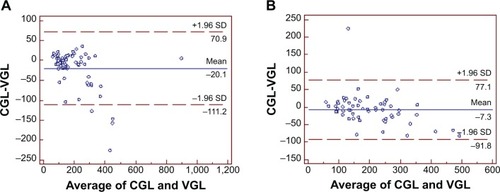
Figure 6 (A) Venous and capillary glucose level comparability in younger patients, aged 18–65 years, with at least one abnormal vital sign finding and high perfusion index (n=24). (B) Venous and capillary glucose level comparability in older patients, aged >65 years, with at least one abnormal vital sign finding and high perfusion index (n=33).
Abbreviations: CGL, capillary glucose level; VGL, venous glucose level; SD, standard deviation.
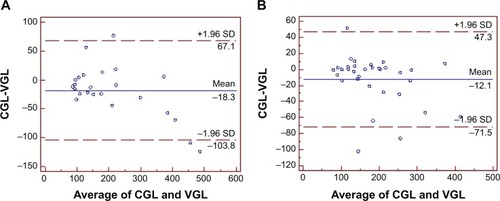
Table 2 Summary of major results