
Figures & data
Figure 1 Sample times, target concentration, and predicted concentrations after infusion using the target-controlled infusion system according to the previous parameters in healthy males.
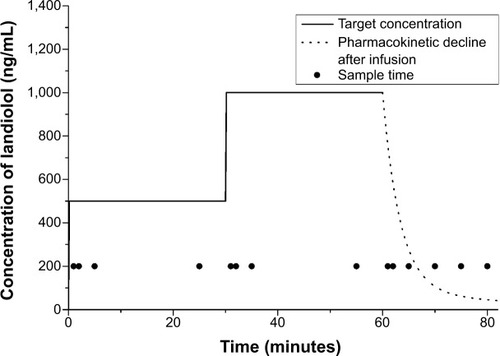
Figure 2 Observed and predicted concentrations of landiolol.
Abbreviation: pCp, predicted plasma concentration.
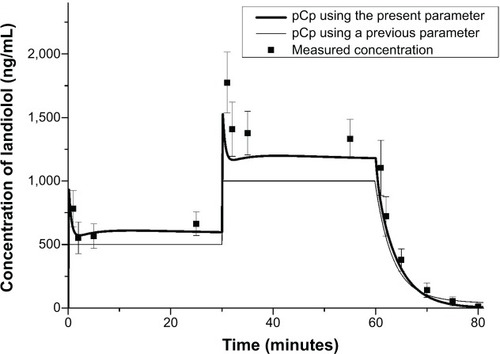
Figure 3 Hemodynamic values.
Abbreviations: bpm, beats per minute; DBP, diastolic blood pressure; HR, heart rate; SBP, systolic blood pressure.
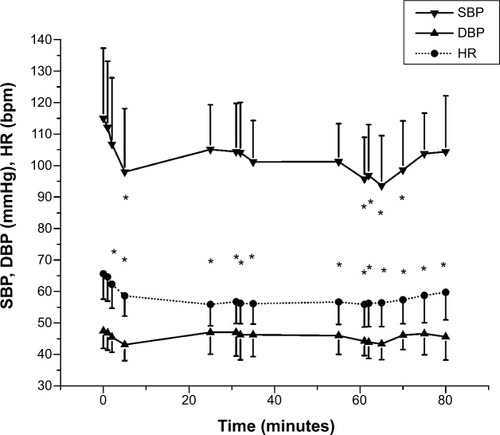
Table 1 Demographics and baseline clinical characteristics of the study patients
Figure 4 OBS versus PRED from the present model.
Abbreviations: OBS, observed concentrations; PRED, predicted concentrations.
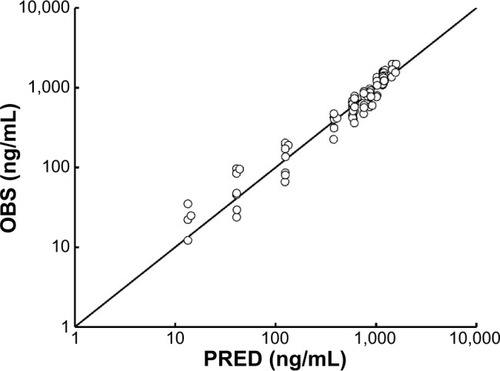
Figure 5 Diagnostic plots of CWRES versus PRED (A) or time after beginning of infusion (B).
Abbreviations: CWRES, conditional weighted residuals; PRED, predicted concentrations.
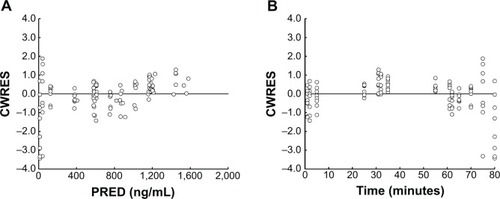
Figure 6 Visual predictive check of the present model.
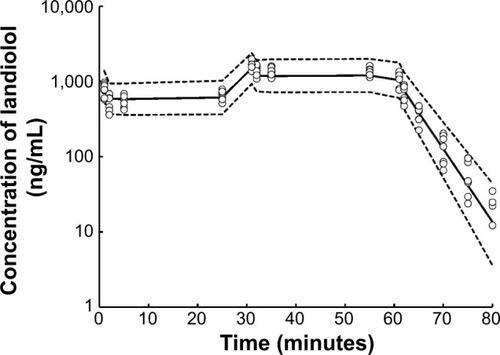
Figure 7 Percent PE versus time after beginning of infusion.
Abbreviation: PE, performance errors.
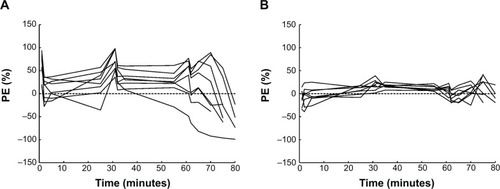
Table 2 Pharmacokinetic parameter estimates of landiolol from the population model
Table 3 Comparison of prediction performance between the previous and present models