
Figures & data
Figure 1 Flow chart showing patient disposition.
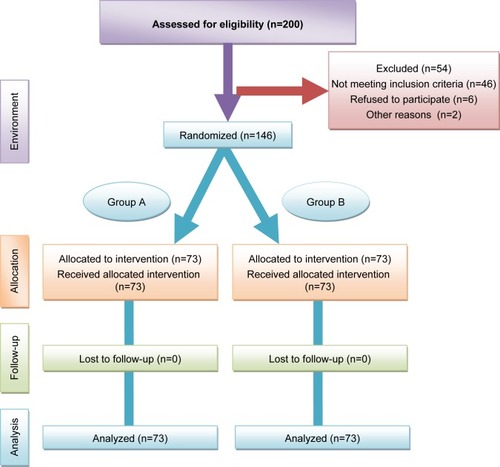
Table 1 Patient characteristics in each group
Table 2 Insulin dose titration algorithm
Table 3 FBG, P2hBG, and HbA1C levels prior to and after treatment in the two groups
Table 4 Hypoglycemia
Table 5 Insulin dose at the end of the study (U/kg)