
Figures & data
Figure 1 Study and design.
Notes: Stage 1, with medication list only; stage 2 all information (medication list, reason for hospital admission, and laboratory values) except drug indication and/or medical history; stage 3 complete case (medication list, reason for hospital admission, laboratory values, drug indication, and/or medical history).
Abbreviations: P, participants; E, expert team.
Abbreviations: P, participants; E, expert team.
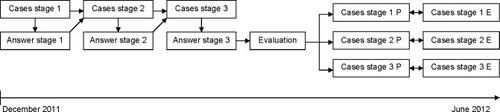
Figure 2 Participation and dropout rates.
Abbreviations: PH, pharmacists; NH, nursing home physicians; GP, general practitioners.
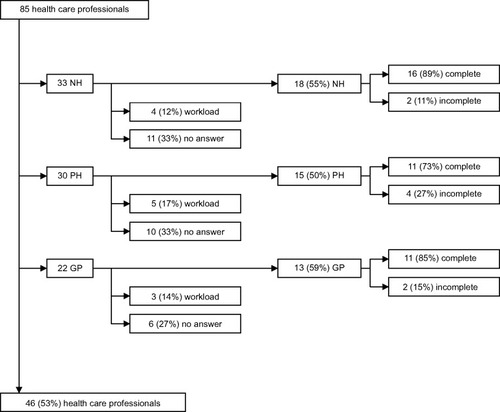
Table 1 Demographic characteristics of the participants
Table 2 Estimated mean percentage ± standard error for cases A, B, and C, differentiated by group and stage
Medication
Laboratory investigations
Medication
Laboratory investigations
Medication
Laboratory values