Figures & data
Table 1 Comparison of treatment results for LVID study
Table 2 Comparison of year 4 treatment results for MTOPS study
Figure 1 Comparison of treatment results with regard to I-PSS scores reported by Casabé et al.Citation25
Abbreviations: I-PSS, International Prostate Symptom Score; LS, least squares; SE, standard error; PBO, placebo; FIN, finasteride; TAD, tadalafil; LSTD, least squares treatment difference.
Notes:
‡Indicates P≤0.001; #Indicates P<0.05. Reprinted from the Journal of Urology; 191(3); Casabé A, Roehrborn CG, Da Pozzo LF, et al; Efficacy and safety of the coadministration of tadalafil once daily with finasteride for 6 months in men with lower urinary tract symptoms and prostatic enlargement secondary to benign prostatic hyperplasia; 727–733. Copyright © 2014, with permission from Elsevier.Citation25
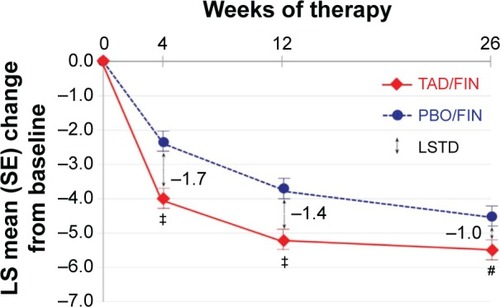
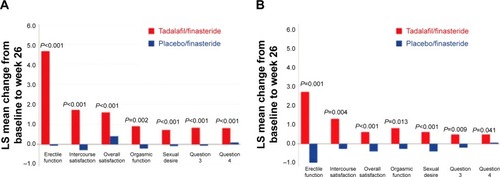
Figure 2 Comparison of treatment results with regard to IIEF scores reported by Glina et al.Citation27
Notes: (A) IIEF domains in men with baseline erectile dysfunction. (B) IIEF domains in men without baseline erectile dysfunction. (A and B) Question 3 related to vaginal penetrative ability. Question 4 related to erection maintenance. Figure reproduced with permission from John Wiley and Sons, from Glina S, Roehrborn CG, Esen A, et al. Sexual function in men with lower urinary tract symptoms and prostatic enlargement secondary to benign prostatic hyperplasia: results of a 6-month, randomized, double-blind, placebo-controlled study of tadalafil coadministered with finasteride. Journal of Sexual Medicine. 2015;12(1):129–138. Copyright © 2014 International Society for Sexual Medicine.
Abbreviations: IIEF, International Index of Erectile Function; LS, least squares.
Abbreviations: IIEF, International Index of Erectile Function; LS, least squares.