
Figures & data
Figure 1 Diagram of patient disposition.
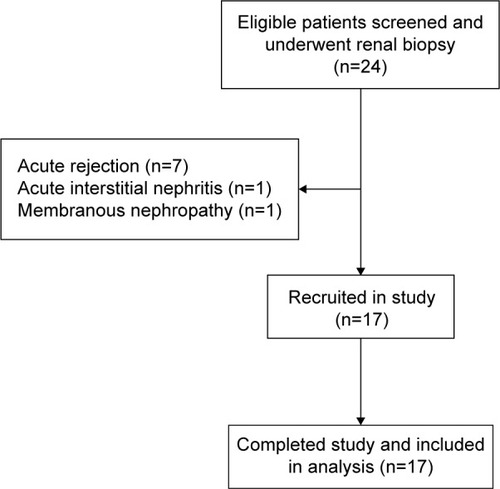
Table 1 Baseline demographic characteristicsTable Footnotea
Figure 2 Slope of renal function decline for individual patients before and after everolimus treatment.
Notes: Open circles denote average estimated glomerular filtration rate (GFR) of the whole group 12 months before treatment, at the time when treatment started, and 12 months after treatment. Error bars denote standard deviation.
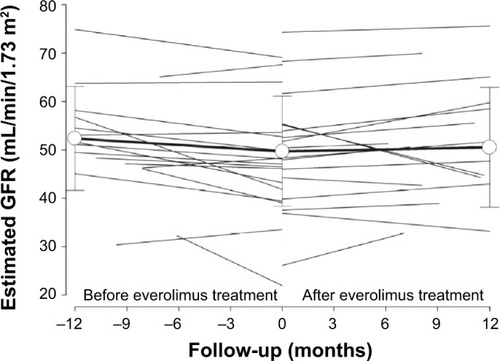
Table 2 Change in glomerular filtration rate decline before and after everolimus therapy, as estimated by different prediction equations
Figure 3 Histological scores of tubular atrophy before and after everolimus.
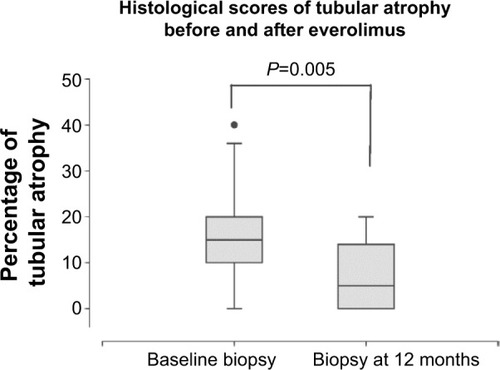
Figure 4 Histological scores of interstitial fibrosis before and after everolimus.
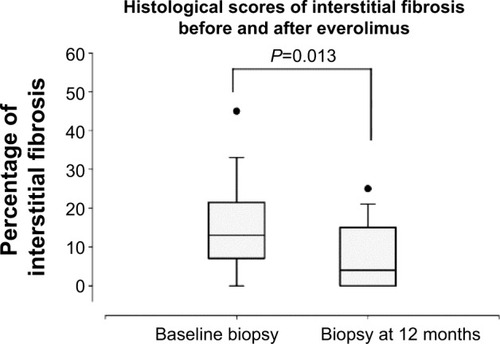
Table 3 Secondary clinical end points and parameters after everolimus therapy