
Figures & data
Figure 1 The study flow and number of weighed patients within the first 7 days of ICU admission.
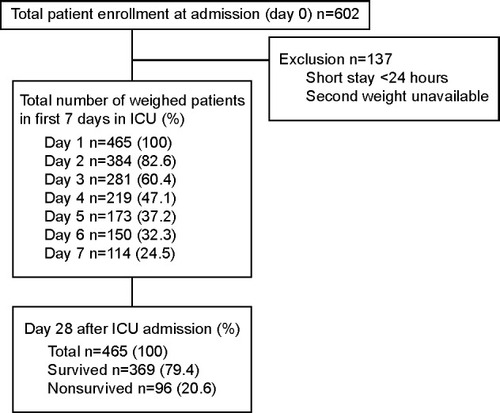
Table 1 Demographic data of ICU mortality patients
Figure 2 The box plot of the daily percentage weight change, categorized by ICU survival status.
Abbreviation: ICU, intensive care unit.
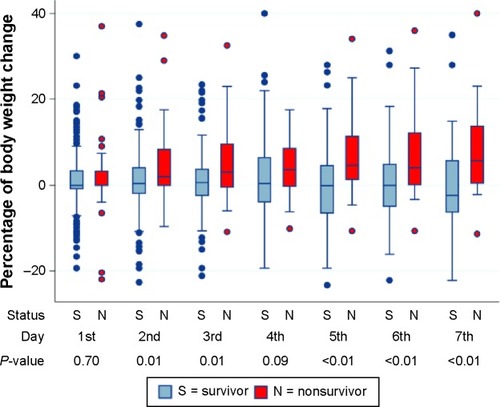
Figure 3 The ROC curve (A) and the intersection of sensitivity and specificity to define the optimal cutoff point (B) of Max%ΔBW for ICU mortality.
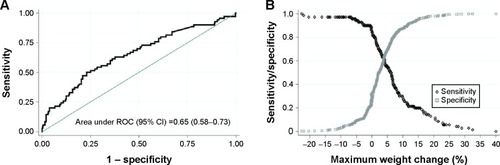
Figure 4 The OR and 95% CI of ICU mortality, categorized by six groups, of Max%ΔBW within the first week of ICU admission.
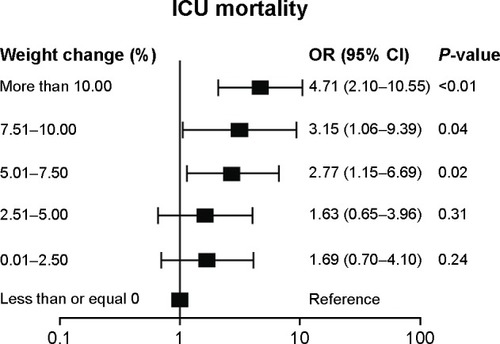
Table 2 Average fluid intake per day of each type of fluid, total output per day, fluid balance per day, total duration, and total fluid accumulation during surgical ICU admissionTable Footnote†
Table 3 Surgical ICU outcomes on univariable analysis of the maximum weight change cutoff point at 5% of admission body weight
Table 4 Multivariable analysis model on the outcomes in the surgical ICU, in each group of patients